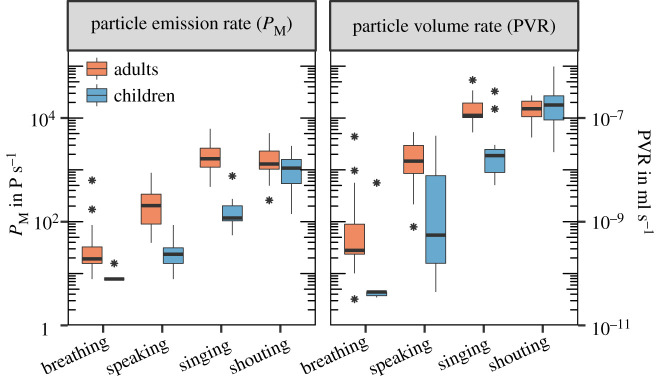
Figure 2.
Comparison of particle emission rate in particles per second (left) and the particle volume rate in millilitres per second (right) for breathing at rest and the different vocalization types speaking, singing and shouting. The box plots are based on the distributions of individual medians of five repetitions per test condition for children (blue, n = 15) and adults (orange, n = 15).

