Figure 6.
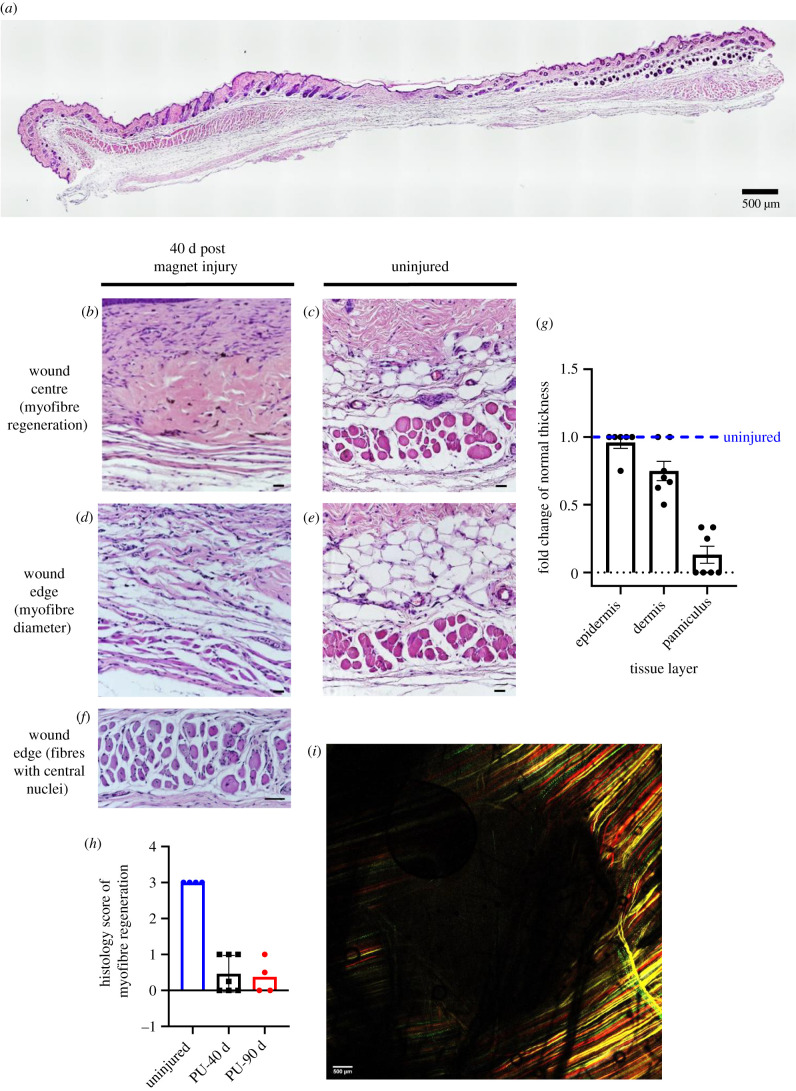
Measures and representative images of muscle regeneration between 40- and 90 d magnet-induced PU and uninjured skinfold. (a) A complete cross-section of wound tissue and surrounding skin at 40 d post injury, stained with H&E. Scale bar is 500 µm. (b–e) Images of the wound tissue at the centre and edge of the magnet-induced PU versus uninjured tissue. Scale bar, 50 µm. (f) Close-up of a wound edge (in the same mouse as (b)), showing fibres that have central nuclei. Scale bar, 50 µm. (g) Fold change in thickness of epidermal, dermal and panniculus layers, comparing pressure-injured tissues at 40 d post-PU versus uninjured control (at dashed line). p < 0.0001 for the difference between panniculus thicknesses. (h) Histological score of myofibre regeneration at 40 and 90 d post injury (PU-40 and PU-90, respectively) versus uninjured control. Note that no improvement in regeneration was observed from 40 to 90 d after injury. (i) A multi-channel confocal image of the wound tissue at 90 d post injury. Scale bar, 500 µm.

