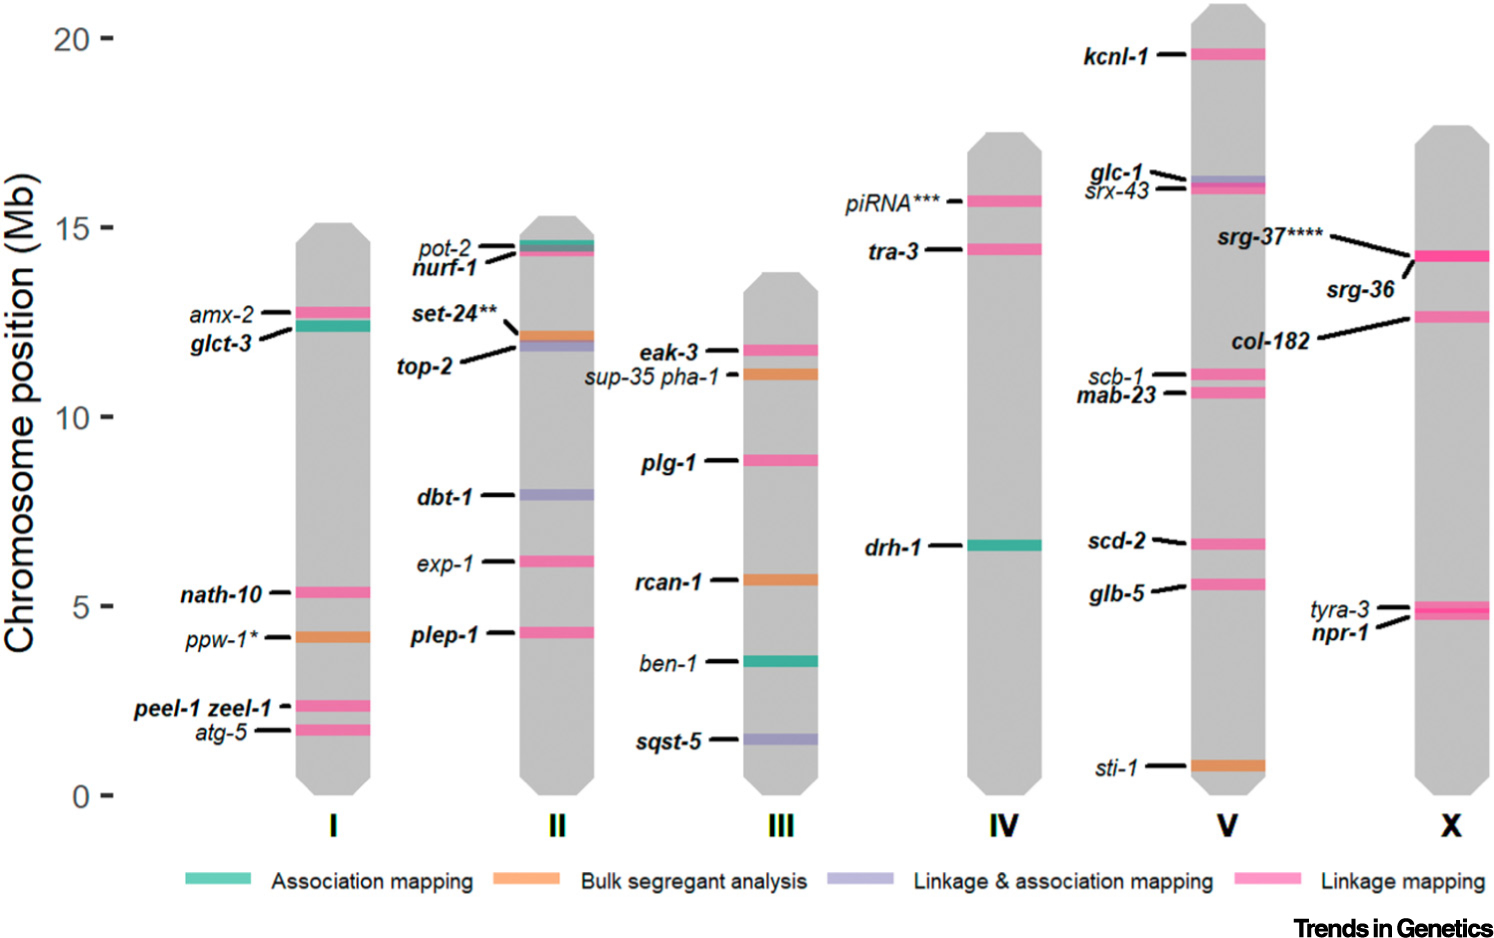
Figure 1.

Key figure: Overview of quantitative trait gene (QTG) chromosome positions
The colors represent the mapping technique(s) that were used for quantitative trait loci (QTL) mapping: bulk-segregant analysis (BSA) (orange); linkage mapping (pink); genome-wide association (GWA) mapping (green); linkage and GWA mapping (purple). The genes in italics represent the QTGs and genes in bold italics represent the QTVs. *ppw-1 was also mapped using linkage mapping [104]. **set-24 was detected by combining linkage mapping and BSA [20]. ***The role of piRNAs was tested using a prg-1 deletion [93]. ****srg-37 was also mapped using GWA mapping [39]. Figure was created using ggplot2 in R.
