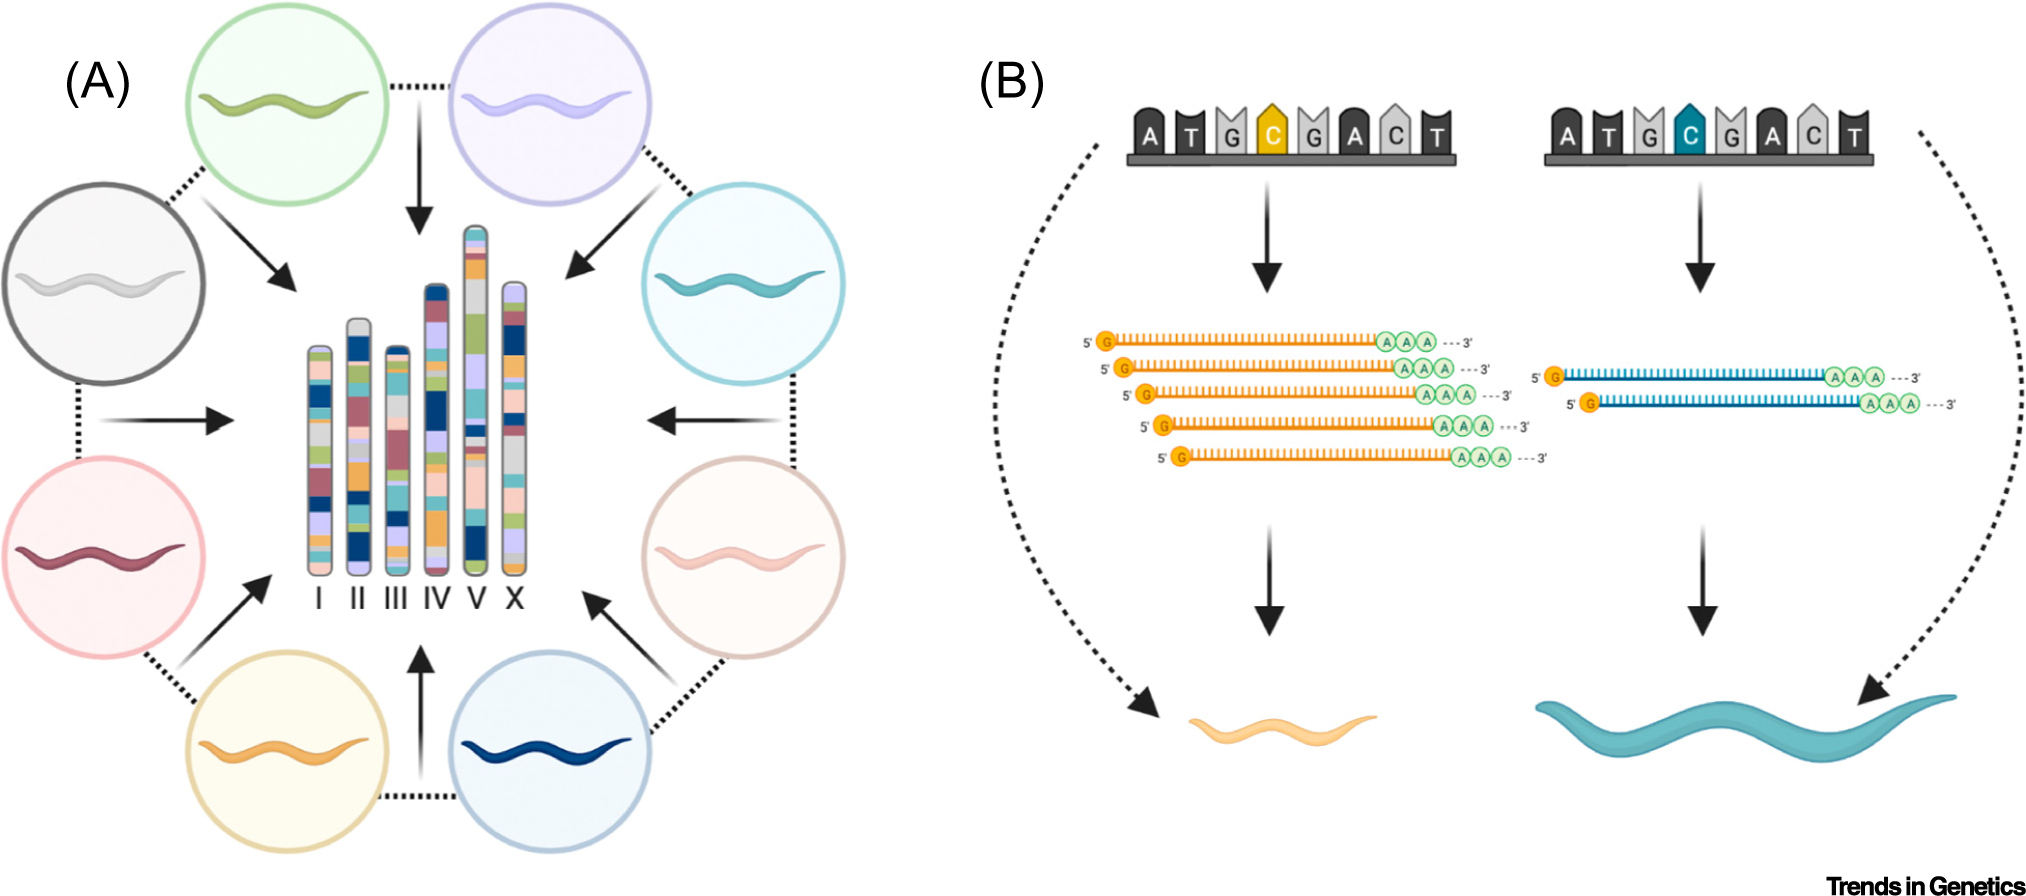
Figure 2. Powerful approaches to quickly identify the genes and molecular mechanisms underlying quantitative trait variation.

(A) A schematic of a hypothetical multi-parent recombinant cross is shown. The eight colored nematodes along the outside represent the parental strains in the cross. The genome of one hypothetical line is shown in the center of the cross with bars to represent chromosomes colored by the genetic background retained from each parental strain. (B) A mediation model where phenotypic variation (animal size) between strains (color) can be explained by variation in gene expression caused by a genetic variant. This figure was created using BioRender.com.
