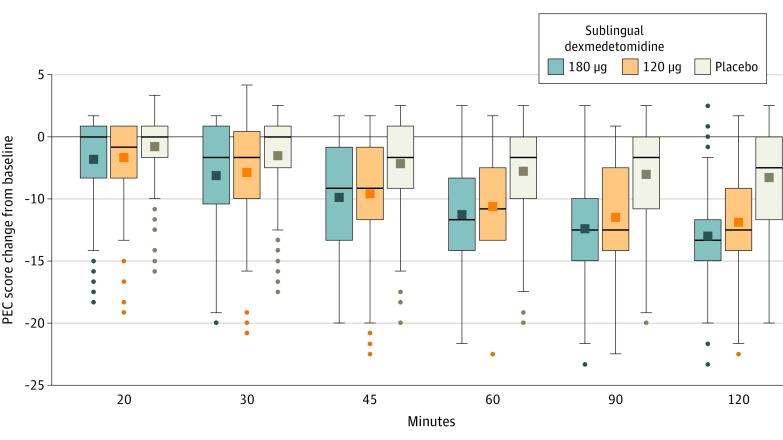
Figure 2. Mean Change From Baseline in the Positive and Negative Syndrome Scale-Excited Component Total Score Through 2 Hours .
Dark squares in boxes indicate the mean; the top box lines, upper quartile; the bottom box line, lower quartile; bars in boxes, median; whiskers, data falling within 1.5 times the interquartile range; dots, values outside the range indicated by the whiskers; and PEC, Positive and Negative Syndrome Scale-Excited Component.

