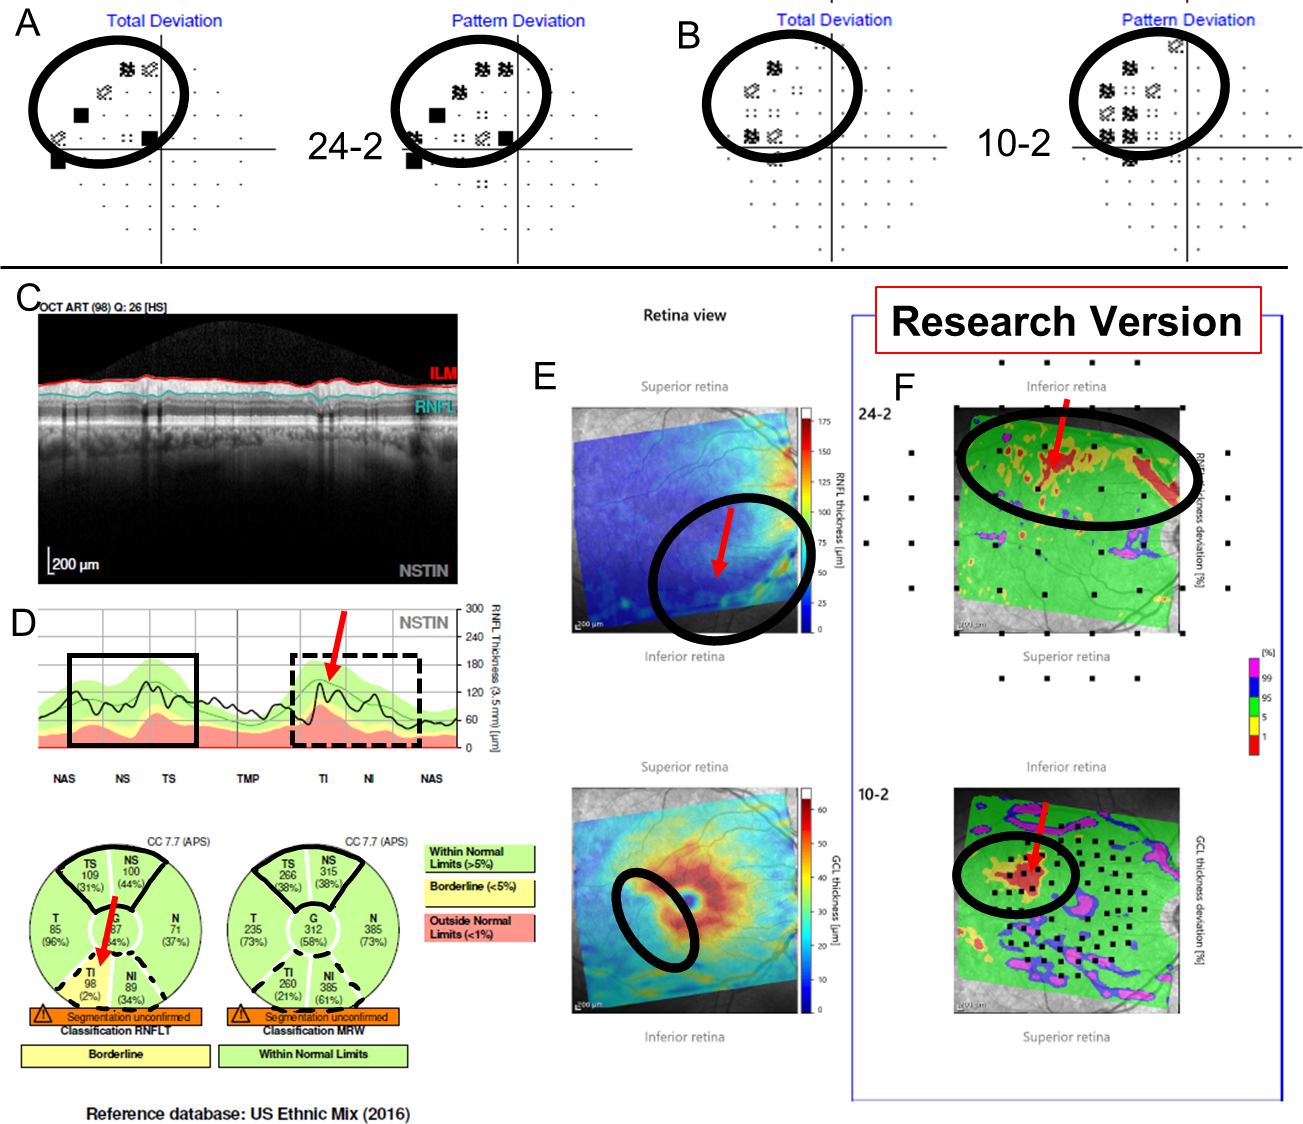
Figure 2:

Additional information for Figure 1 shows the Total Deviation (TD) and Pattern Deviation (PD) from the 24–2 (A) and from the 10–2 (B) visual fields (VFs), while (C) shows a research version of a new Spectralis report (Heidelberg Engr. Inc.) that provides the pie charts for the cRNFL and BMO-MRW. Note the cRNFL thickness plot (D) is in the Nasal-Superior-Temporal-Inferior-Nasal (NSTIN) orientation. The thickness maps of the RNFL (E, top) and RGC layer (E, bottom) and their probability maps [RNFL (F, top) and RGC (F, bottom)] in field view are also provided. For more details regarding the structure and benefits of a one-page report, see Ref 16. While the superior hemidisc shows structural agreement, the inferior hemidisc shows structural disagreement. The disagreement was classified as a BMO-MRW FN upon post-hoc analysis, as the RS indicated that the inferior hemidisc was abnormal. Evidence for damage in the inferior hemidisc is outlined in black on the VFs (A and B), as well as on the RGC and RNFL plots (C).
