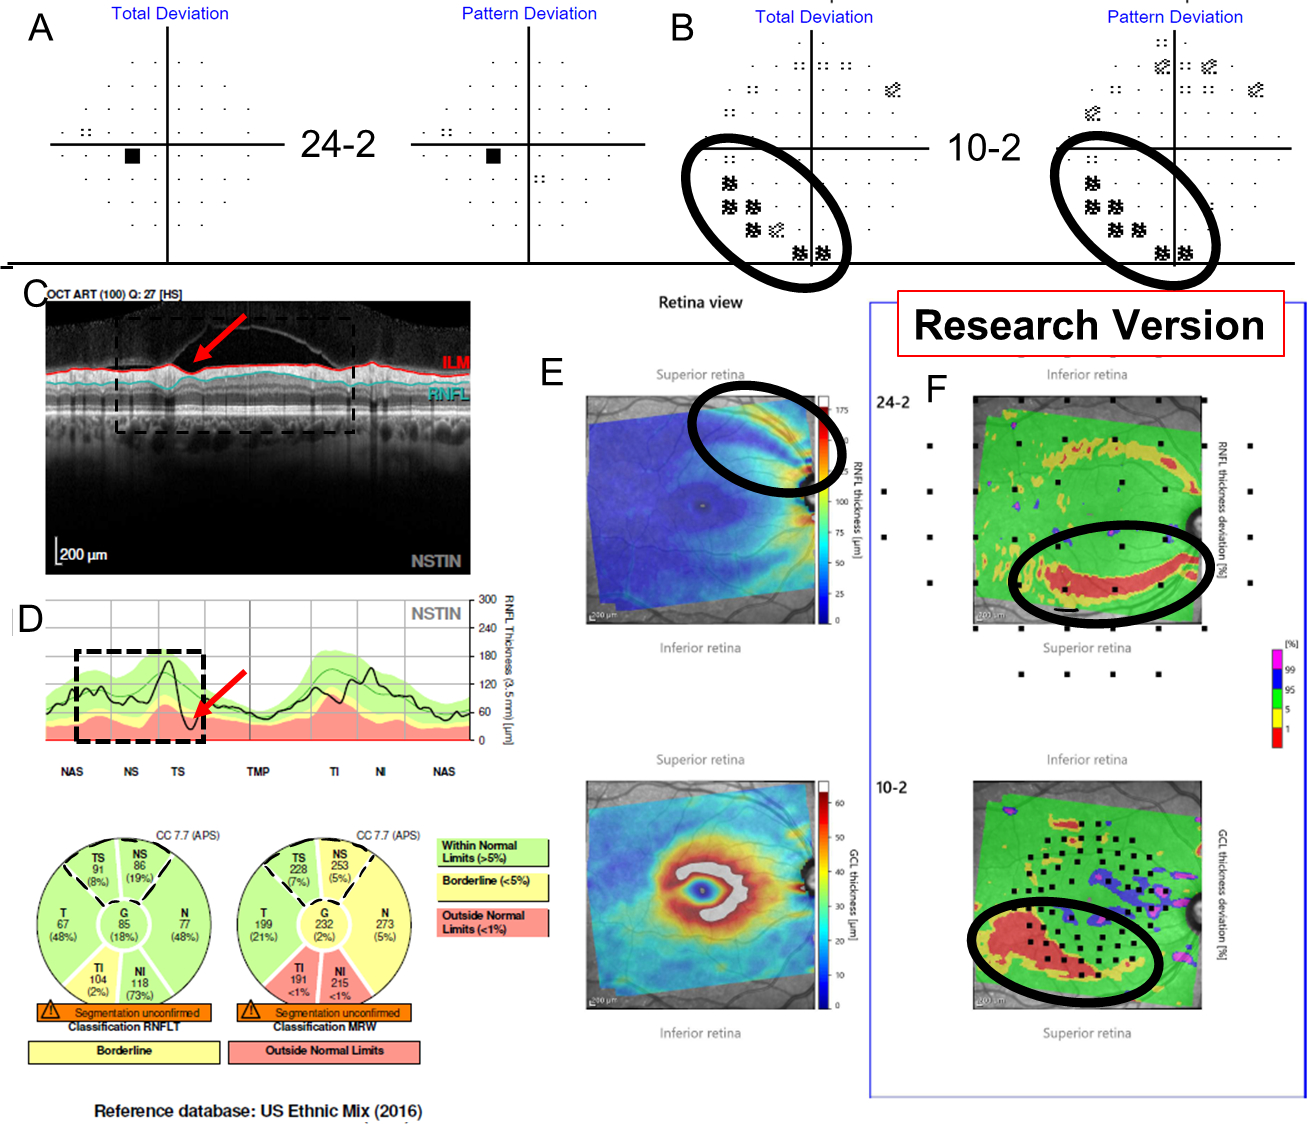
Figure 4:

Additional information for Figure 3 shows TD and PD from the 24–2 (A) and from the 10–2 (B), while (C) shows a research version of a new Spectralis report (Heidelberg Engr. Inc.) that provides the pie charts for the cRNFL, BMO-MRW, as well as the thickness probability plots for both the RGC and RNFL. The superior hemidisc shows structural disagreement that was deemed a cRNFL FN upon post-hoc analysis, as the RS classified the superior hemidisc as abnormal. Evidence for this cRNFL FN in the superior hemidisc is outlined in black on the VFs (A and B), as well as on the RGC and RNFL plots (C).
