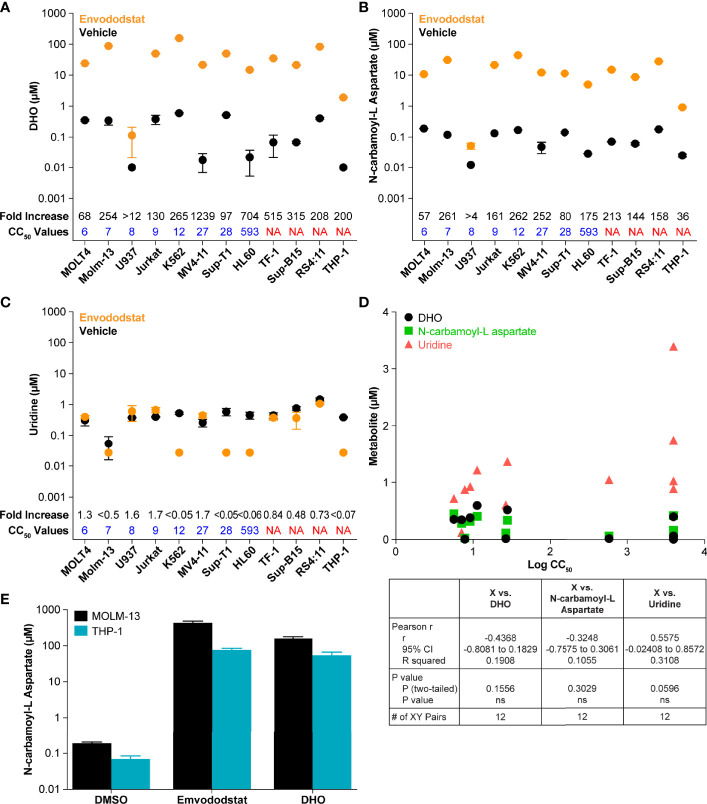
Figure 2.
The figures show baseline (untreated) and post-treatment levels for the metabolites DHO (A) and N-carbamoyl-L-aspartate (B), and uridine (C) following treatment with 1 µM emvododstat. Included for each cell line is the CC50 just above the x-axis and the fold increase (treated/untreated) measured in each cell line at the top of the graph. Values represent the mean ± SD for 3 replicates. (D) Shown are the baseline levels of DHO, N-carbamoyl-L-aspartate, and uridine vs the log CC50 values. Below the graph are the correlation statistics calculated using Prism (GraphPad). (E) Shown are levels of N-carbamoyl-L-aspartate measured in MOLM-13 or THP1 cells after 4 h of incubation with 1 µM emvododstat or with 10 mM DHO. Where levels of a measured metabolite were below the lower limit of quantification (LLOQ), a value of LLOQ/2 was used for subsequent calculations.

