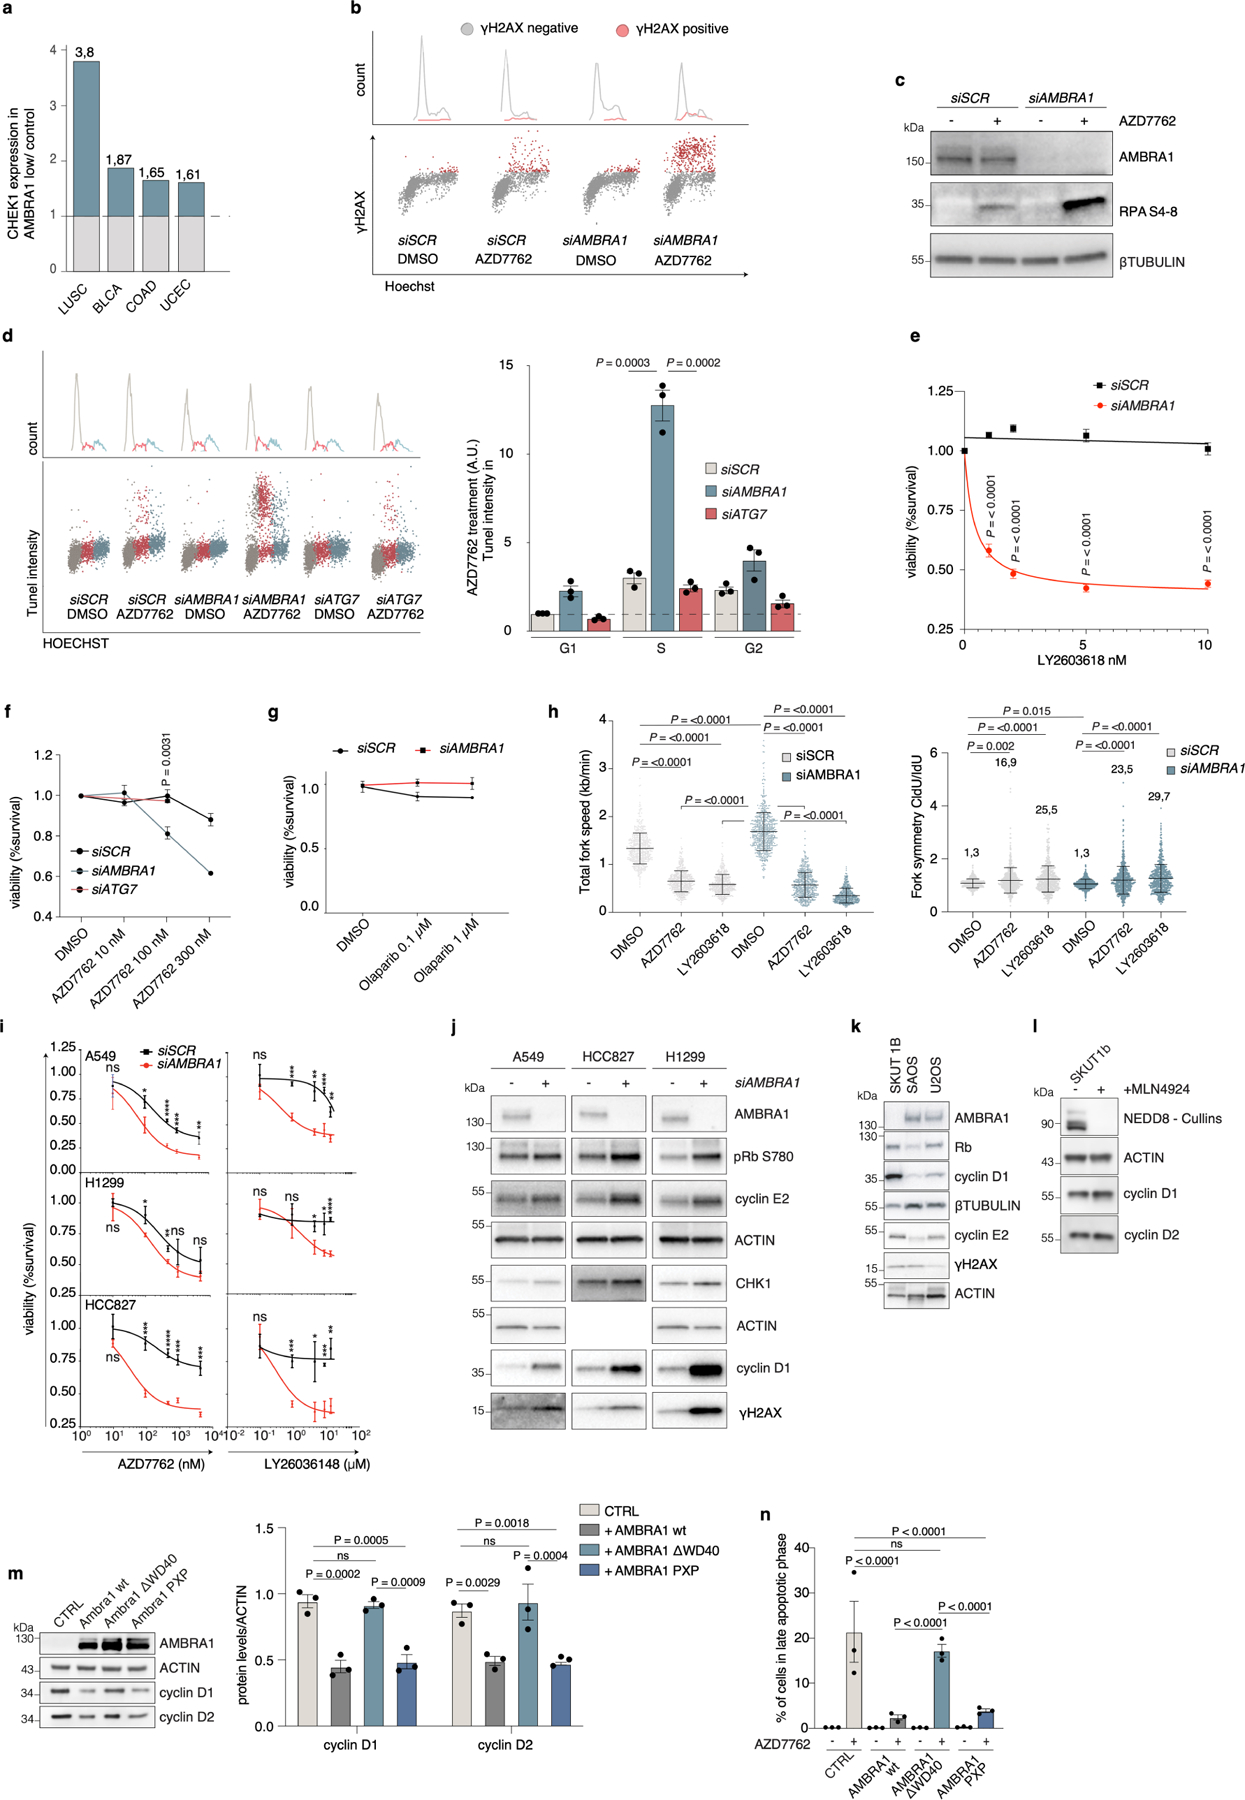
Extended Data Fig. 8 |. AMBRA1 deficiency is synthetic lethal with CHK1 inhibitors.

a, Ratio between CHEK1 expression in the AMBRA1-low subpopulation of cancers with respect to normal tissue. b, Gating strategy for Fig. 3c. Bottom, scatter plots of total nuclear DNA intensity versus γH2AX intensity (siSCR DMSO, n = 1,850; siSCR AZD, n = 1,716; siAMBRA1 DMSO, n = 1,866; siAMBRA1 AZD, n = 1,731 cells; representative of three independent experiments). The γH2AX-positive cells (arbitrary cut-off) are indicated in red. Top, Hoechst nuclear intensity versus counts. γH2AX-positive cells are indicated by the red line. c, Immunoblot of AMBRA1, RPA(pS4/8) and β-tubulin in control or AMBRA1-silenced BJ-hTERT cells that were untreated or treated with AZD7762. d, Left, gating strategy for the quantification on the right. Top, Hoechst nuclear intensity versus counts. Bottom, scatter plots reporting single-cell total nuclear DNA intensity versus TUNEL intensity. Right, TUNEL-positive cells in the different cell phases calculated based on Hoechst intensity (n = 3). P values by two-tailed unpaired t-test. e, Viability analysis of control and AMBRA1-silenced BJ-hTERT cells treated with the indicated concentrations of LY2603618 for 24 h (n = 3). P values by two-stage step-up (Benjamini, Krieger and Yekutieli). f, Cell viability in control, AMBRA1- and ATG7-silenced BJ-hTERT cells that were untreated or treated with AZD7762 for 24 h (n = 4 for Control and treatments with 100 nM AZD7762). P value by two-tailed unpaired t-test. g, Cell viability in control and AMBRA1-silenced BJ-hTERT cells that were untreated or treated with olaparib for 24 h (n = 3). Analysis by two-tailed unpaired t-test. h, Fork symmetry analysis from BJ-hTERT cells treated for 24 h with 100 nM AZD7762 or 5 μM LY2603618 (scored forks: siSCR DMSO, n = 533; siSCR AZD, n = 560; siSCR LY, n = 548; siAMBRA1 DMSO, n = 601; siAMBRA1 AZD, n = 543; siAMBRA1 LY, n = 548). P values by two-tailed Mann–Whitney test. Data are mean ± s.d. i, Cell viability analysis of control and AMBRA1-silenced A549, H11299 and HCC827 lung cancer cell lines treated with the indicated concentrations of AZD7762 and LY2603618 (n = 3) for 24 h. P values by two-stage step-up (Benjamini, Krieger and Yekutieli). Data are mean ± s.d. j, Immunoblot of the indicated proteins in control or AMBRA1-silenced A549, HCC827 and H1299 cells (n = 3). k, Immunoblot of sarcoma cell lines (n = 3). l, Immunoblot of SKUT-1B cells treated with the inhibitor MLN4924 for 4 h (n = 3). m, Left, immunoblot of SKUT-1B cells reconstituted with wild-type AMBRA1 or mutant AMBRA1(ΔWD40) or AMBRA1(PXP). Right, densitometry quantification of the indicated normalized protein levels (n = 3). P values by two-sided one-way ANOVA followed by Sidak’s multiple comparisons test. n, Late apoptosis analysis in SKUT-1B cells reconstituted with wild-type AMBRA1, AMBRA1(ΔWD40) or AMBRA1(PXP) and treated with 200 nM AZD7762 for 24 h (n = 3). P values by two-sided one-way ANOVA followed by Tukey’s multiple comparisons test. Unless otherwise stated, n refers to biologically independent samples; data are mean ± s.e.m. *P < 0.05, **P < 0.01, ***P < 0.001, ****P < 0.0001. Exact P values are provided in the ‘Statistical analysis and data reproducibility’ section of the Supplementary Methods.
