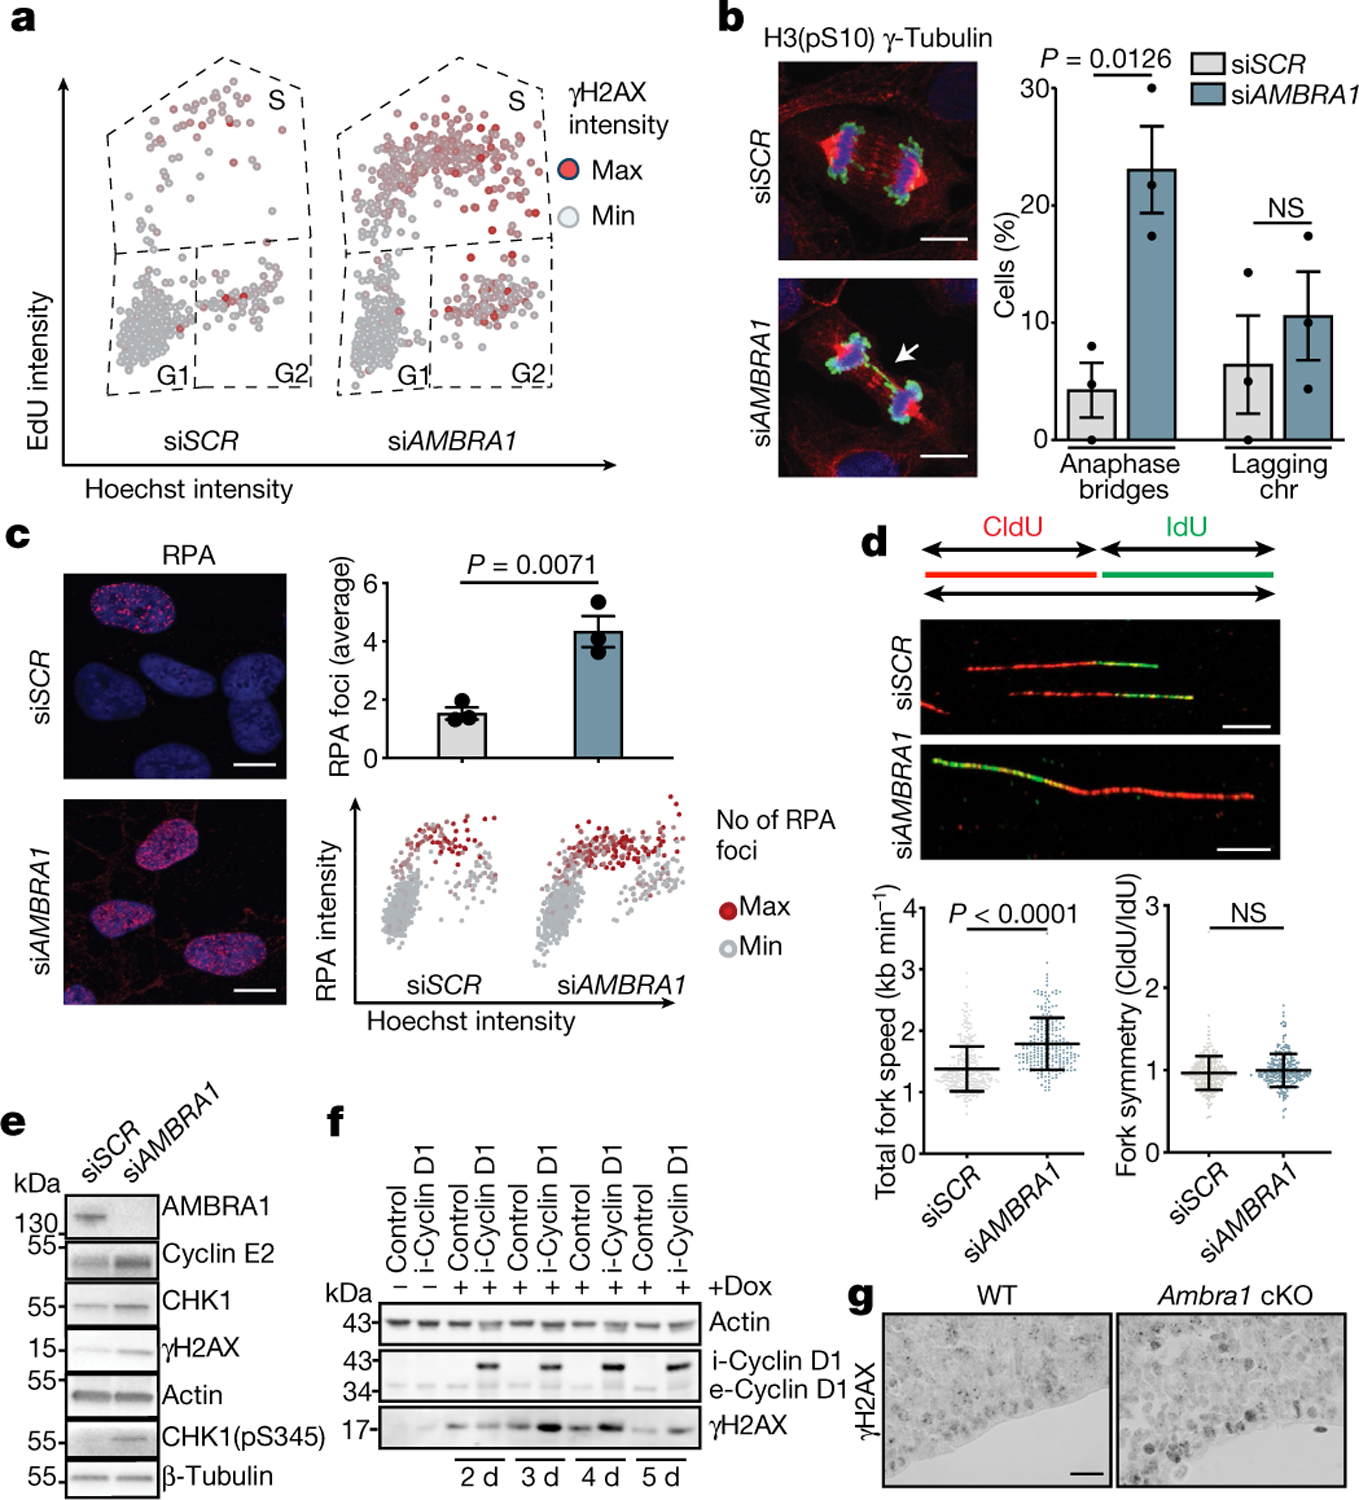
Fig. 2 |. Depletion of AMBRA1 causes replication stress.

a, Scatter plots reporting single-cell γH2AX, EdU and Hoechst total nuclear intensities from AMBRA1-silenced (siAMBRA1) and control (siSCR) BJ-hTERT cells (siSCR, n = 716 cells; siAMBRA1, n = 715 cells; representative of three independent experiments). b, Left, AMBRA1-silenced and control U2OS cells stained for γ-tubulin (red), histone H3 phosphorylated at Ser10 (H3(pS10); green) and Hoechst (blue). Scale bars, 10 μm. Right, quantification of mitotic cells showing anaphase bridges and lagging chromosomes (chr) (n = 3). c, Left, AMBRA1-silenced and control BJ-hTERT cells immunostained for RPA (siSCR, n = 704 cells; siAMBRA1, n = 720 cells). Scale bars, 10 μm. Right, quantification of the average number of RPA foci and scatter plot of Hoechst intensity versus RPA intensity (n = 3). d, Top, DNA fibres from control and AMBRA1-silenced BJ-hTERT cells. Scale bars, 10 μm. Bottom, quantification of mean fork speed (kb min−1) and of fork symmetry analysis after incorporation and staining of 5-iodo-2’-deoxyuridine (IdU) and 5-chloro-2’-deoxyuridine (CldU). Scored forks: siSCR, n = 301; siAMBRA1, n = 233. Data are mean ± s.d. e, Immunoblot analysis of the indicated proteins in control or AMBRA1-silenced BJ-hTERT cells. f, Immunoblot analysis of cyclin D1 and γH2AX in control BJ-hTERT cells or cells in which cyclin D1 expression was induced by doxycyclin (dox) treatment for the indicated number of days. The prefixes i- and e- indicate the induced and the endogenous form of cyclin D1, respectively (n = 3). g, Sagittal sections of wild-type or Ambra1 cKO E13.5 embryos, stained for γH2AX antibody (n = 3). Scale bar, 40 μm. Quantification of immunohistochemistry is shown in Extended Data Fig. 5l. Actin or β-tubulin were used as loading controls. Unless otherwise stated, data are mean ± s.e.m.; n refers to biologically independent samples. Data were analysed using a two-tailed unpaired t-test (b, c) or two-tailed Mann–Whitney test (d).
