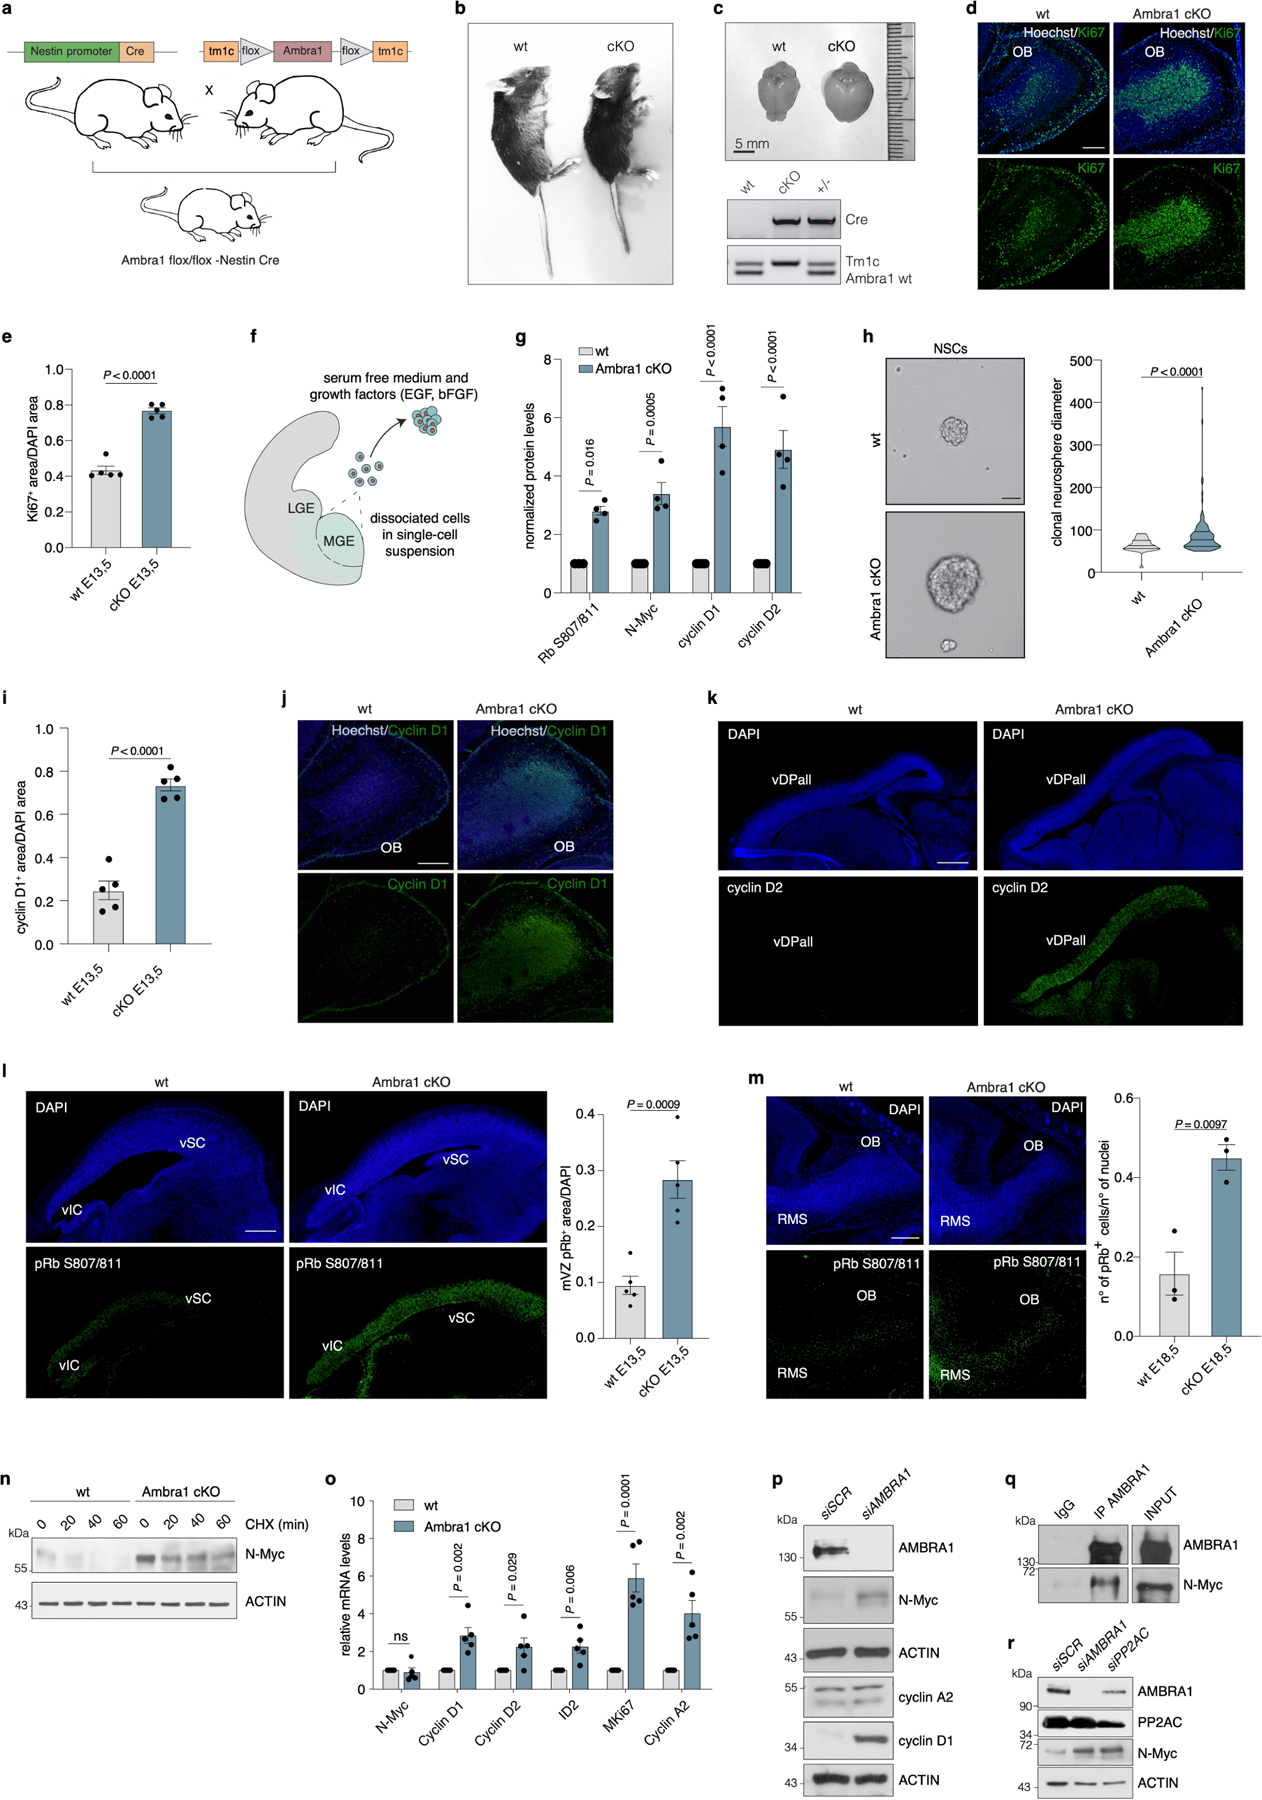
Extended Data Fig. 1 |. AMBRA1 regulates cyclin D stability in NSCs.

a, Schematic for production of the conditional knockout mouse model. b, c, Images of wild-type and Ambra1 cKO P21 mice (b) and brains (c). c, bottom, representative image of PCR amplification of Tm1c, Ambra1 and Cre. d, Wild-type and Ambra1 cKO olfactory bulbs in sagittal sections of E18.5 embryos, stained for Ki67 antibody and Hoechst (n = 3). e, Quantification of Ki67+ cell area in the whole brain of wild-type and Ambra1 cKO E13.5 embryos (sagittal sections shown in Fig. 1b) (n = 5). P value by two-tailed unpaired t-test. f, Representative scheme of NSCs extraction and cell culturing from mouse embryo medial ganglionic eminences (MGE). LGE, lateral ganglionic eminences. g, Densitometry quantification of normalized protein levels in wild-type and Ambra1 cKO NSCs shown in Fig. 1c (n = 4). P values by two-sided one-way ANOVA followed by Sidak’s multiple comparisons test. h, Left, representative images of NSCs extracted from mouse embryo medial ganglionic eminences. Right, violin plot of clonal neurosphere diameters in wild-type and Ambra1 cKO NSCs (n = 3; total of 128 neurospheres analysed for each condition). P value by two-tailed unpaired t-test. i, Whole-brain quantification of E13.5 wild-type and Ambra1 cKO cyclin D1 staining normalized over DAPI, represented in Fig. 1e. P value by two-tailed unpaired t-test (n = 5). j, Wild-type and Ambra1 cKO olfactory bulbs in sagittal sections of E18.5 embryos, stained for cyclin D1 antibody and Hoechst (n = 3). k, Sagittal sections of wild-type and Ambra1 cKO E13.5 embryos, stained for cyclin D2 (n = 3). l, Left, representative images of sagittal sections of the mesencephalic ventricular zone in wild-type and Ambra1 cKO E13.5 embryos, stained for RB(pS807/811) (n = 5). Right, quantification of RB(pS807/811-positive area in the mesencephalic ventricular zone of E13.5 wild-type and Ambra1 cKO embryos (n = 5). P value by two-tailed unpaired t-test. m, Left, representative images of RB(pS807/811) in sagittal sections of the olfactory bulb in wild-type and Ambra1 cKO E18.5 embryos. Right, quantification of the number of RB(pS807/811)-positive cells (n = 3). P value by two-tailed unpaired t-test. n, Immunoblot of N-MYC after cycloheximide treatment in wild-type and Ambra1 cKO NSCs (n = 3). o, Quantitative PCR with reverse transcription (qRT‒PCR) of NSCs; the investigated genes are at the bottom of the graph (n = 5). P values by two-tailed unpaired t-test. p, Immunoblot of control and AMBRA1silenced SH-SY5Y cells (n = 3). q, Immunoblot of AMBRA1 immunoprecipitation in SH-SY5Y cells. r, Immunoblot for AMBRA1, PP2AC and N-MYC in SH-SY5Y cells silenced for the indicated genes (n = 3). Unless otherwise stated, n refers to biologically independent samples. For immunoblots, actin was used as loading control. Data are mean ± s.e.m. Scale bars, 250 μm.
