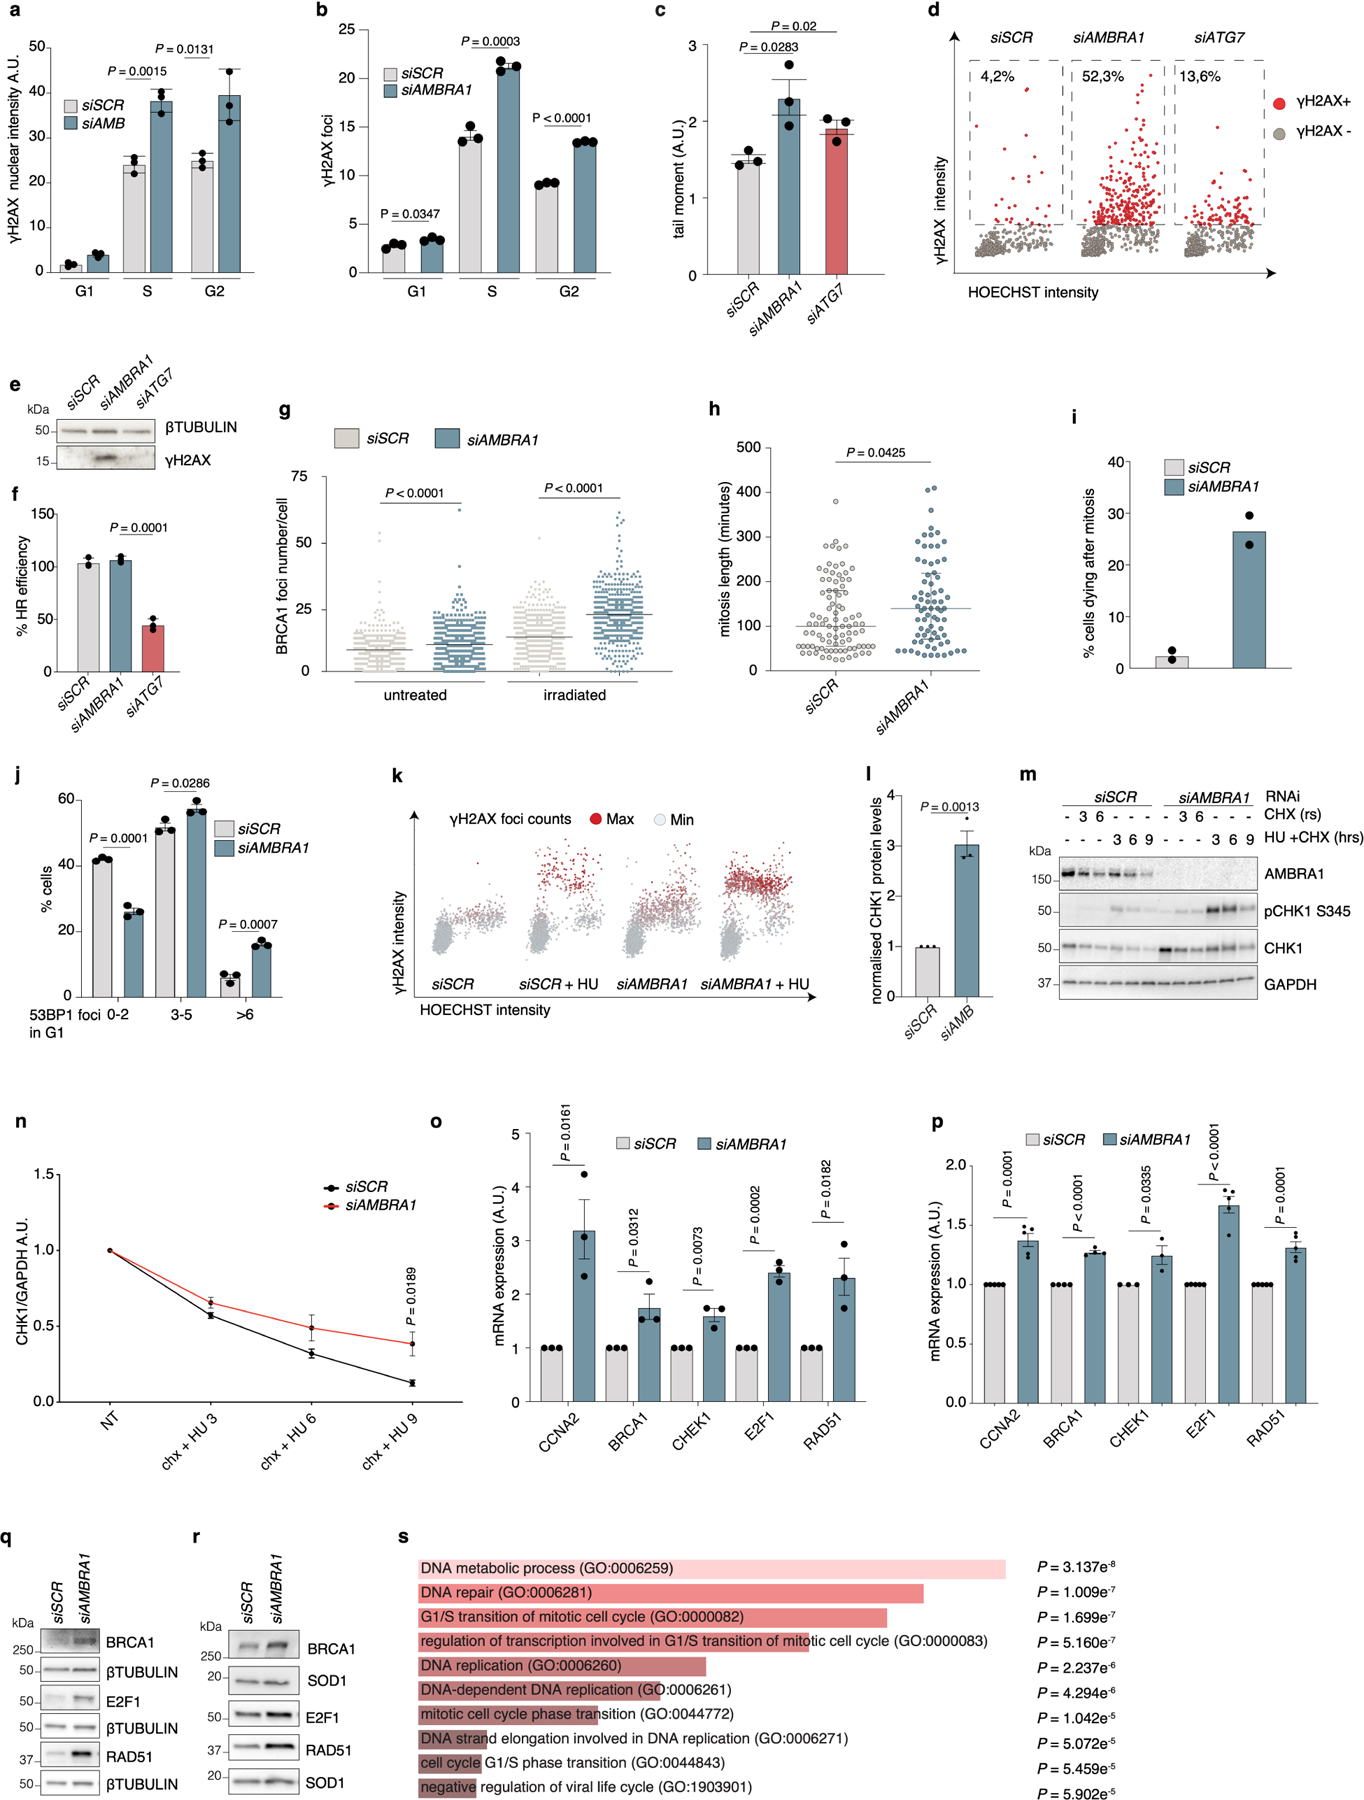
Extended Data Fig. 4 |. AMBRA1 deficiency causes replication stress.

a, Total γH2AX nuclear intensity in the different cell-cycle phases of BJ-hTERT cells (n = 3). Data are mean ± s.d. b, Average number of γH2AX foci in control or AMBRA1-silenced U2OS cells (n = 3). c, Alkaline comet assay of control, AMBRA1- and ATG7-silenced U2OS cells (n = 3). d, Scatter plots showing γH2AX versus Hoechst total nuclear intensities from immunostainings of control, AMBRA1- and ATG7-silenced BJ-hTERT cells. The proportion of γH2AX-positive cells (red, arbitrary cut-off) is indicated (siSCR, n = 721; siAMBRA1, n = 725; siATG7, n = 733 cells examined over 3 independent experiments). e, Immunoblot of γH2AX in control, AMBRA1- and ATG7-silenced BJ-hTERT cells (n = 3). f, Homologous recombination (HR) efficiency in control, AMBRA1- and ATG7-silenced U2OS cells (n = 3). Data are mean ± s.d. g, Number of BRCA1 foci per nucleus in control and AMBRA1-silenced U2OS cells either untreated or treated with 3-Gy irradiation, stained against BRCA1 (n = 500 cells examined over 3 independent experiments, centre indicates the mean). h, Time in mitosis in control (n = 91 cells examined over 3 independent experiments) or AMBRA1-silenced (n = 72 cells examined over 3 independent experiments) cells. Bars represent median and interquartile range. i, Dying cells upon mitotic exit as evaluated by time-lapse imaging (n = 2 independent experiments; more than 60 cells per condition). j, Distribution of 53BP1 nuclear foci in G1 U2OS cells (n = 3). k, Total γH2AX versus Hoechst intensity in control and AMBRA1-silenced BJ-hTERT cells that were untreated or treated with 2 mM hydroxyurea (HU) for 2 h (siSCR, n = 2,481; siAMBRA1, n = 2,237; siSCR + HU, n = 2,484; siAMBRA1 + HU, n = 2,281 cells; scatter plots are representative of n = 3 independent experiments). l, Quantification of normalized protein levels of CHK1 represented in Fig. 2e (n = 3). m, n, BJ-hTERT cells as in Extended Data Fig. 4k treated with cycloheximide or with cycloheximide and 2 mM hydroxyurea. m, Immunoblot analysis of the indicated proteins in total cell lysates. n, Quantification of normalized CHK1 protein expression levels (n = 4). o, p, qRT–PCR analyses of the indicated genes in control or AMBRA1-silenced BJ-hTERT (o) and U2OS (p) cells, respectively (CCNA2, E2F1 and RAD51 n = 5; BRCA1 n = 4; CHEK1 n = 3). q, r, Immunoblot analysis of the indicated proteins in control or AMBRA1-silenced U2OS (q) and BJ-hTERT (r) cells (n = 3 in both conditions). s, Gene ontology (GO) biological processes (2018) from enrichment analysis of DEA (Differential Expression Analysis) genes from RNA sequencing (RNA-seq) experiments. DEA originating from three RNA-seq independent experiments was used as input for the web-based software EnrichR34,35. P values computed using Fisher’s exact test; clearer bars show a smaller P value. Unless otherwise stated, n refers to biologically independent samples; data are mean ± s.e.m. Data were analysed using a two-tailed unpaired t-test (a, b, c, f, j, l, n, o, p) or two-tailed Mann–Whitney test (g, h). For immunoblots, β-tubulin, SOD1 or GADPH were used as loading control.
