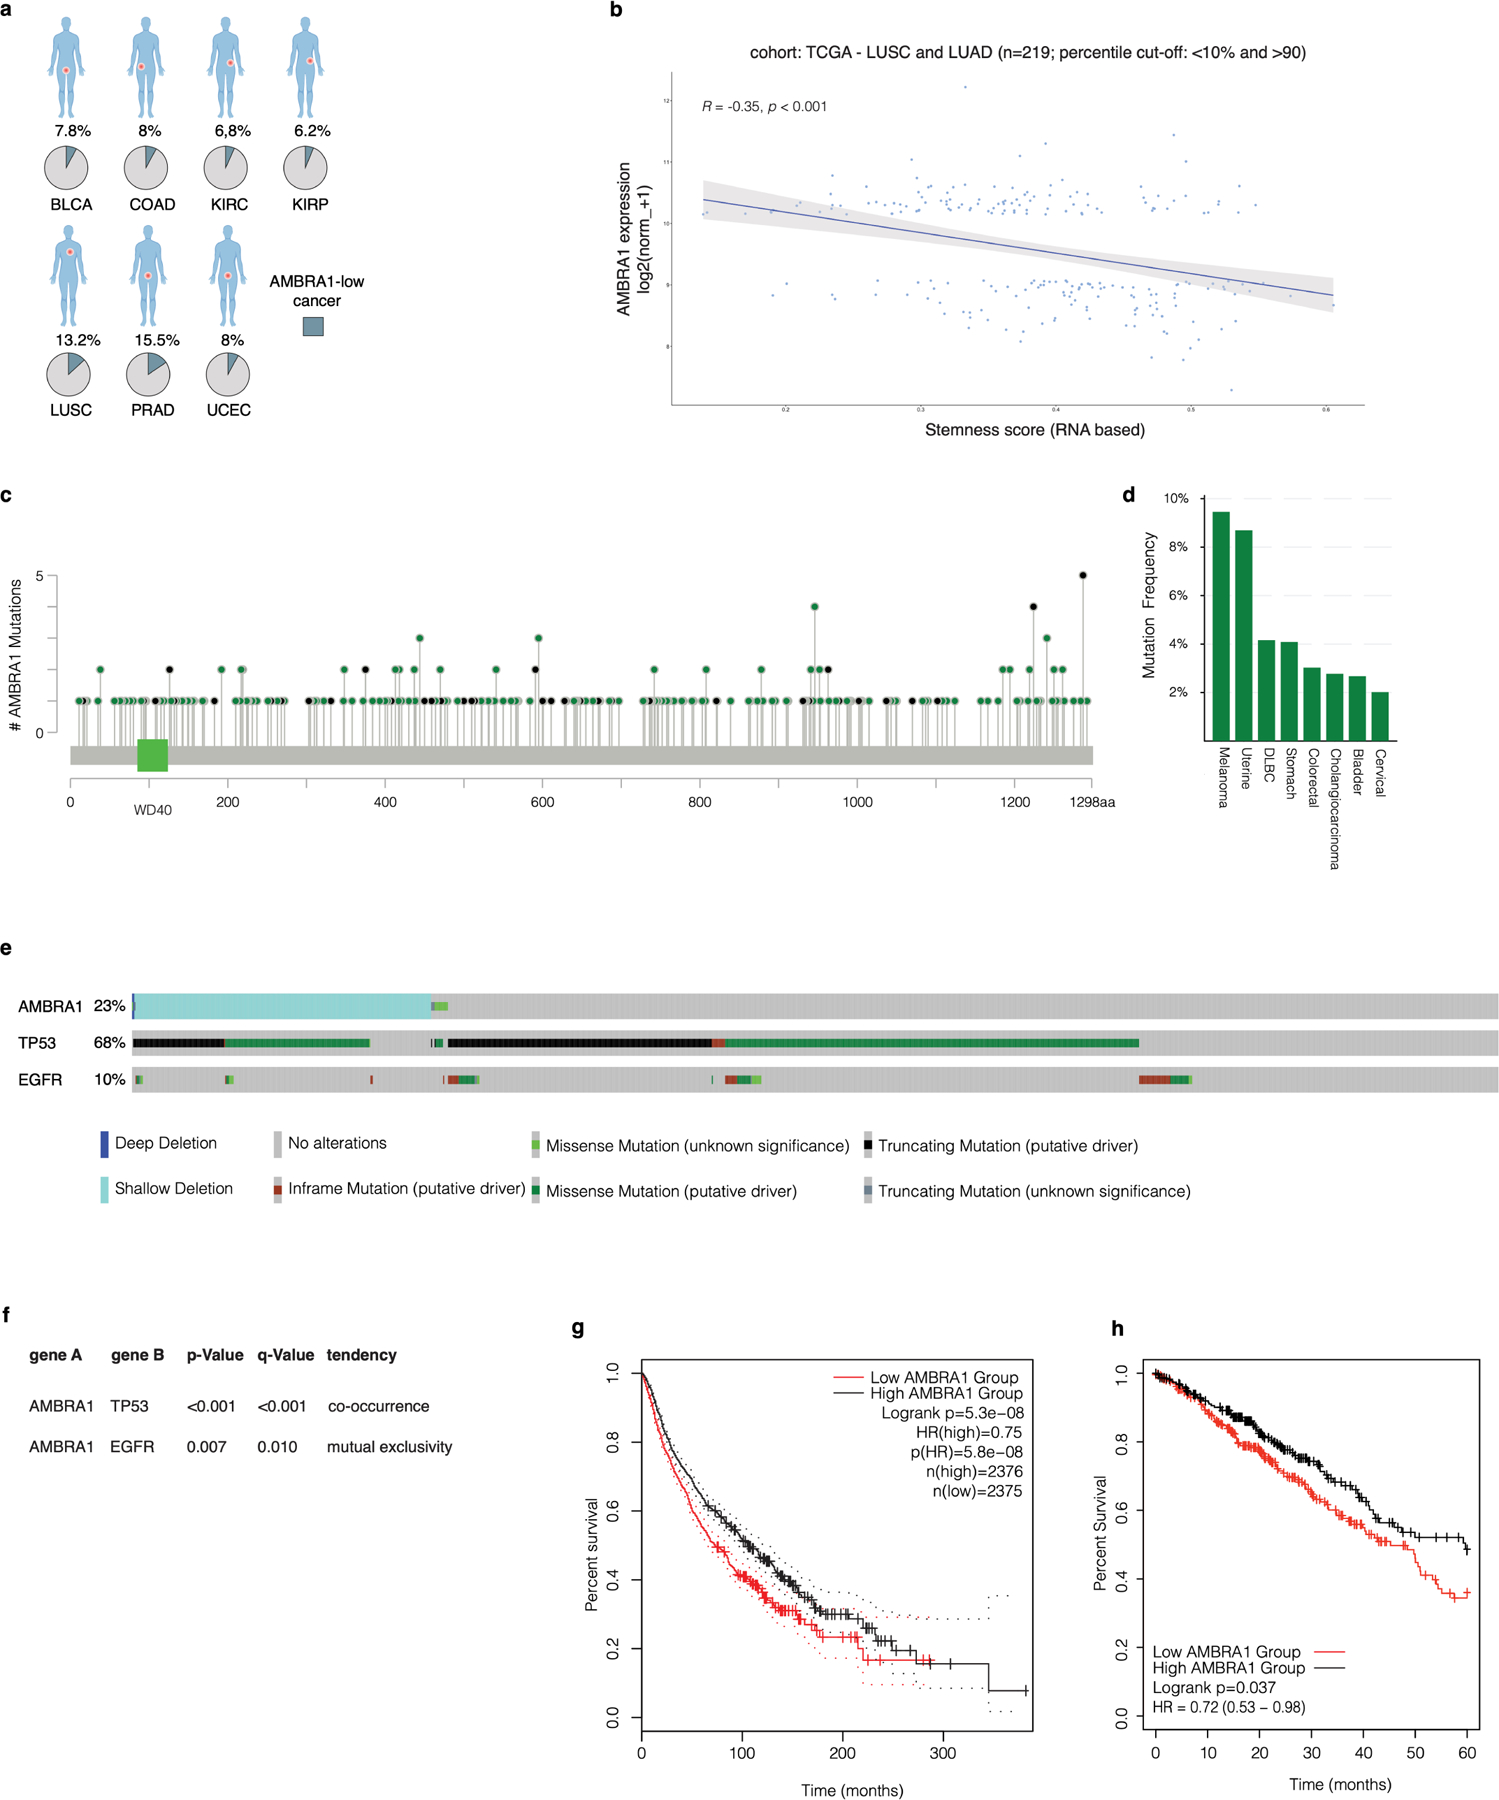
Extended Data Fig. 6 |. Bioinformatics analysis of AMBRA1 in cancer.

a, Bioinformatics analysis of expression data from the TCGA database. Pie charts show the percentage of AMBRA1-low cancers (light blue) with respect to the total (grey) in the indicated datasets. BLCA, bladder urothelial carcinoma; COAD, colon adenocarcinoma; KIRC, kidney renal clear cell carcinoma; KIRP, kidney renal papillary cell carcinoma; LUSC, lung squamous cell carcinoma; PRAD, prostate adenocarcinoma; UCEC, uterine corpus endometrial carcinoma. b, Xena correlation analysis of AMBRA1 mRNA expression and stemness score. The shaded area in the plot indicates the confidence interval (95%). c, Lolliplots showing the distribution of AMBRA1 mutations annotated in TCGA Pan-Cancer Atlas Studies datasets. d, Frequency of AMBRA1 mutations (expressed as a percentage) in TCGA Pan-Cancer Atlas Studies datasets. The cut-off was selected at 2%. e, Oncoprint of AMBRA1 alterations (homodeletions, shallow deletions, mutations), and TP53 and EGFR mutations from TCGA Pan-Lung Cancer datasets. f, Mutual exclusivity and co-occurrence analysis of the indicated genes from TCGA Pan-Lung Cancer datasets. P values derived from one-sided Fisher’s exact test. g, Kaplan–Meier analysis of patients in the Pan-Cancer Atlas Studies database was generated based on the expression level of AMBRA1 (low, below 20%; high, above 80%). Plot was downloaded from the online database GEPIA36 (http://gepia2.cancer-pku.cn/#analysis). P values derived from one-sided log-rank Mantel–Cox test). h, Kaplan–Meier analysis of overall survival based on RNA-seq analysis of AMBRA1 mRNA levels using the KM-plotter37 lung adenocarcinoma database.
