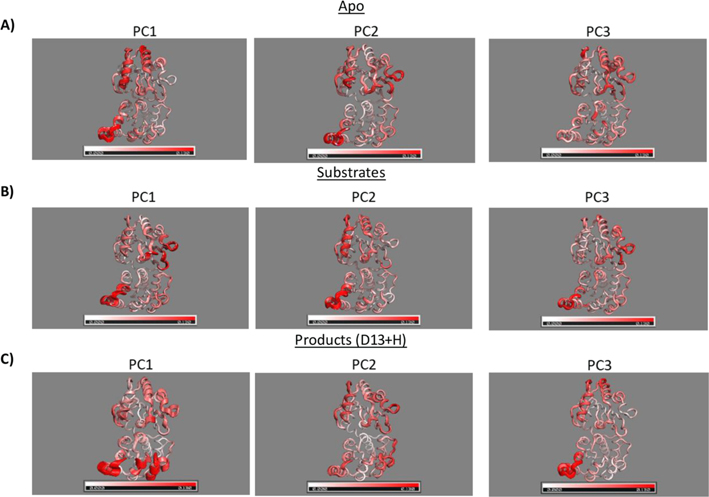
Figure 6.
First three principal components of (A) HepI apo, (B) substrate complex, and (C) product complex with protonated Asp13. Interpolation of extreme points for each principal component onto the average structure gives rise to a motion that is represented by the thickness of the ribbon diagram. Cα RMSF of each principal component is represented by the red color gradient with increasing color representing increasing motion.

