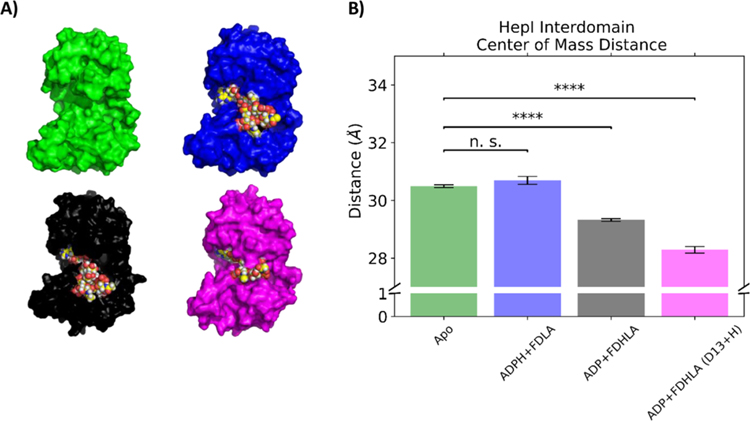
Figure 8.
(A) Final frame surface representation of HepI simulations with space filling ligands and (B) bar plot of center of mass distance between N and C termini of HepI in the apo (green), substrate (blue), product with deprotonated Asp13 (black), and product with protonated Asp13 complex simulations (magenta). (n.s. = “not significant,” **** = p < 0.01).

