
Fig. 1.
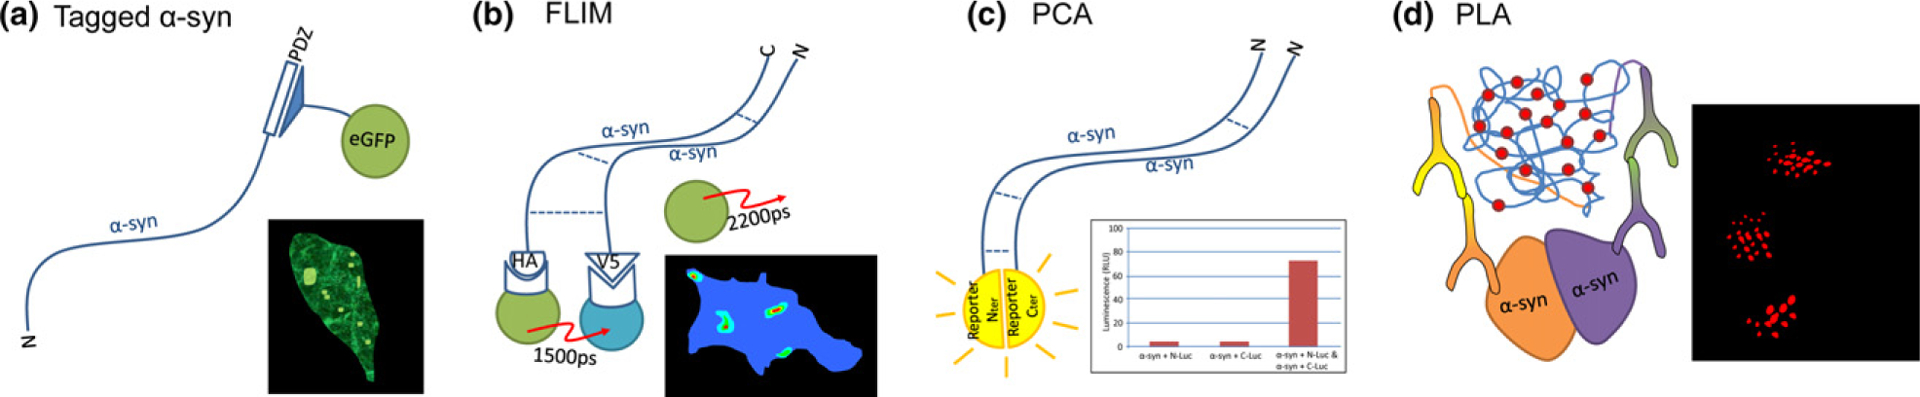
A number of methods have been developed to visualize aggregating α-synuclein in cellular models. These methods include the indirect (a) where synuclein containing a PDZ binding motif epitope is co-expressed with the corresponding PDZ domain fused to eGFP, sensitively labeling α-synuclein, with aggregates presenting as bright puncta (Opazo et al, 2008). Multimeric conformations of α-synuclein are more directly visualized using fluorescence lifetime imaging microscopy (FLIM) (b) by expressing α-synuclein containing small epitope tags. These can be targeted with FRET donor and acceptor secondary antibodies where the proximity of the interaction between synuclein molecules determined as the fluorescence lifetime of the donor fluorophore (Klucken et al. 2006). More recently (c) protein complementation assay (PCA) approaches have been used where synuclein tagged with either N- or C- terminal portions of a split reporter (fluorescent or bioluminescent) is expressed and the reporter signal used as a proxy for dimeric or higher order oligomeric species (Moussaud et al, 2015). In order to label endogenous α-synuclein aggregates, PLA can be employed (d) where proximity-dependent rolling circle amplification of oligonucleotide-labeled antibodies generates a signal to mark α-synuclein aggregates (Roberts et al, 2015)