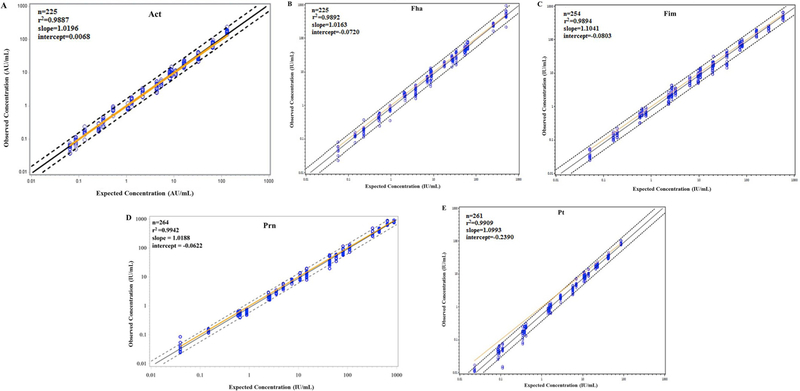
Fig. 3.
Dilutional linearity. (A) Act, (B) Fha, (C) Fim, (D) Prn, and (E) Pt. All results have been log10 transformed. Dotted lines are 95% confidence interval of individual observations. Solid black line is the best fit regression line, solid yellow line is where observed concentration = expected concentration. Slope, intercept and r2 are indicated. (For interpretation of the references to colour in this figure legend, the reader is referred to the Web version of this article.)

