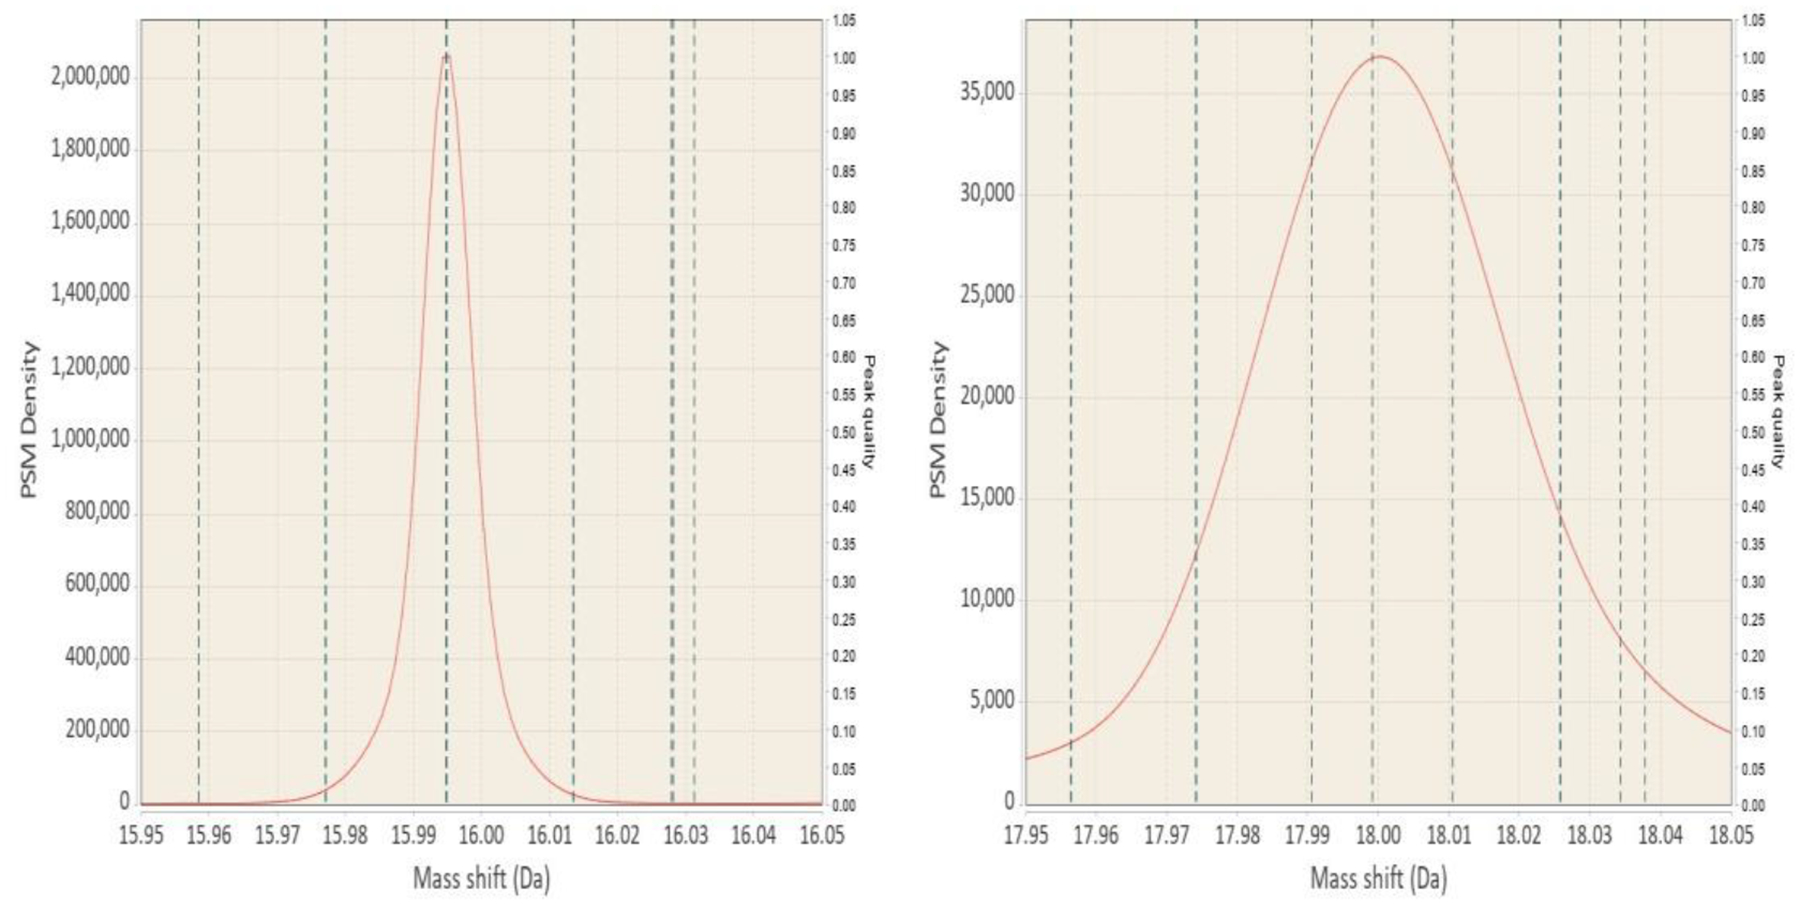
Figure 5:

Visual guide to estimating peak width in your data. Vertical lines on the plots mark locations of known modifications. Horizontal scale is the same in both panels. Left panel shows the Oxidation peak, which has no interfering modifications near the main +15.9949 peak. While there are other known mass shifts, they are quite far away and are very uncommon compared to Oxidation. For comparison the +18 region is shown in the right panel. That region corresponds to lots of various aminoacid substitutions, addition of Ammonium and others.
