
Figure 7:
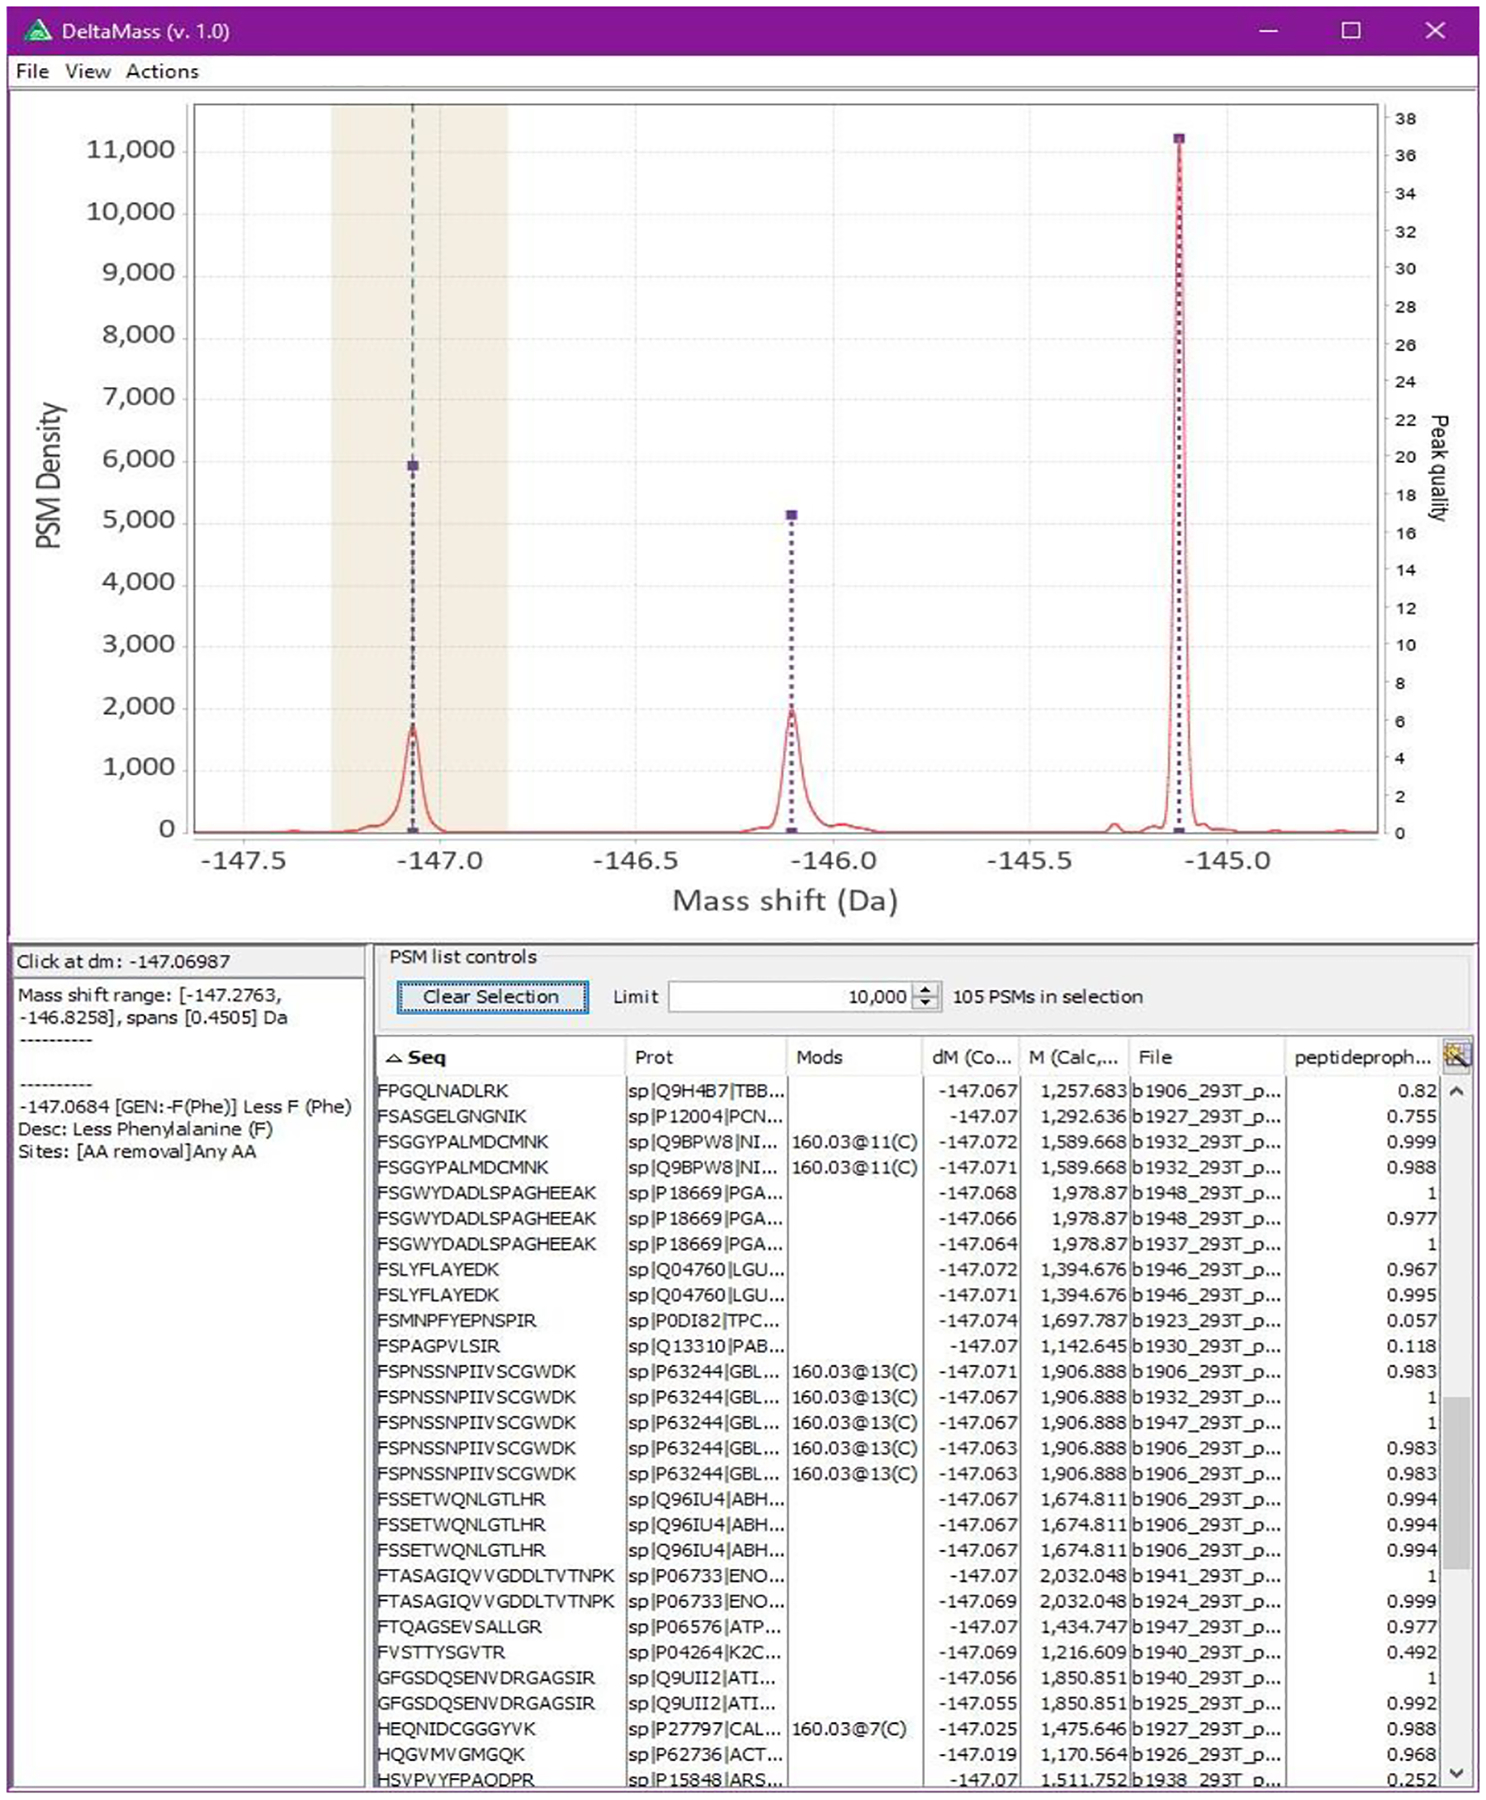
Interactive kernel density function viewer, displaying PSMs and known modifications. PSMs from the selected region (highlighted) are displayed in the table, known modification information is shown on the bottom left. Detected peaks are rendered as purple dotted lines and teal dashed lines running vertically denote locations of known modifications. In this example it can be observed that many sequences have Phenylalanine (symbol ‘F’, monoisotopic mass 147.0684) in the first position suggesting that this peak is likely due to in-source fragmentation. Even though loss of Phe is not listed in UniMod, it is reported by the included automatic annotation generator.