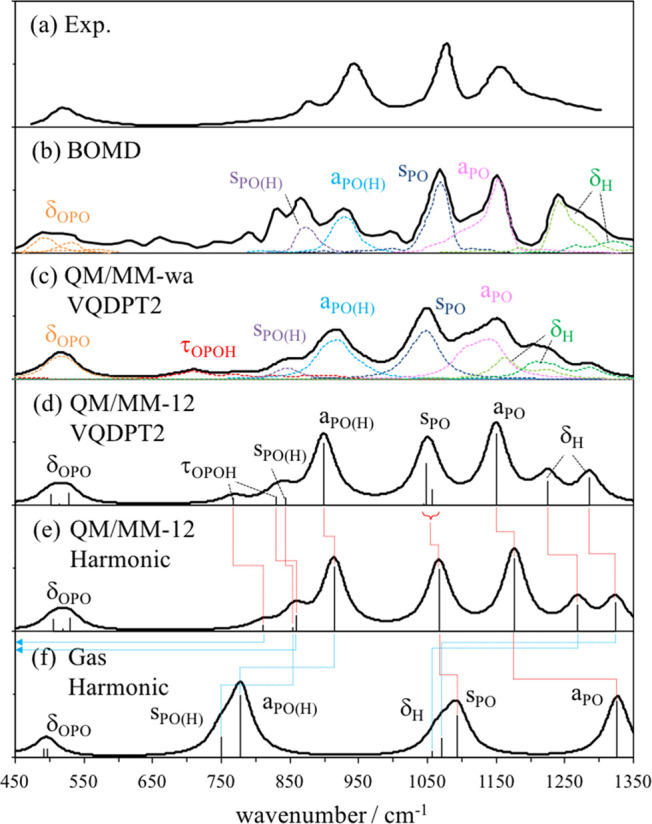
Figure 4.

(a) Experimental IR spectrum of H2PO4– in solution.66 (b) IR spectrum obtained by Born–Oppenheimer (BO) MD based on the B3LYP-D/TZV2P level in the previous work.132 IR spectra calculated by QM/MM in this work: (c) weight-average of VQDPT2 spectra over Nwat = 9–16, (d) VQDPT2 for Nwat = 12, and (e) harmonic calculation for Nwat = 12. (f) Harmonic spectrum of H2PO4– isolated in the gas phase. The spectrum is constructed using Lorentz functions with a width of 40 cm–1.
