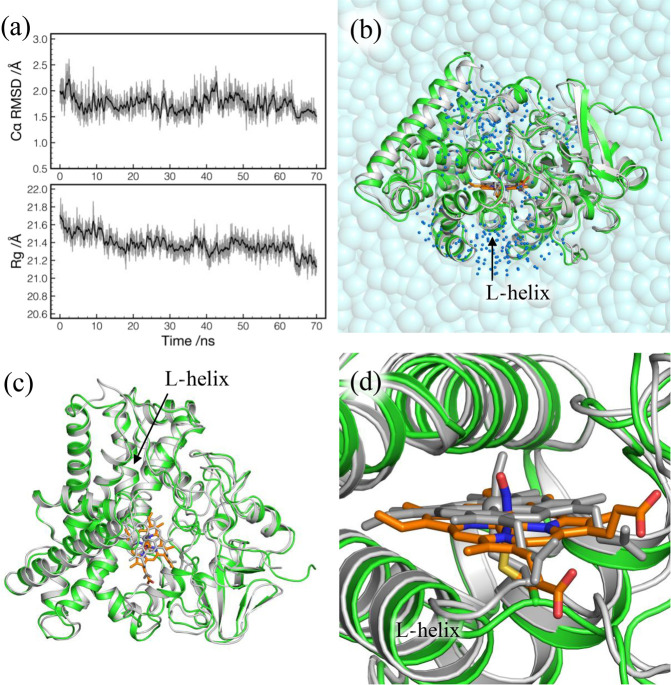
Figure 5.
(a) RMSD from the X-ray crystal structure (top) and the radius of gyration (Rg) (bottom) as a function of simulation time in the production run. RMSD is calculated for Cα atoms of residues 4–403. Rg is obtained using backbone heavy atoms of residues 4–403 with mass weighting. (b) QM/MM optimized geometry of P450nor for NVT4 (colored) superimposed with the X-ray crystal structure (gray). The two structures are fit by Cα atoms of residues 4–403. Water molecules within 20 Å of NO (blue dots) are relaxed in QM/MM calculations. (c) Top view of part b without water molecules. (d) Close view of part b around the heme group with NO.

