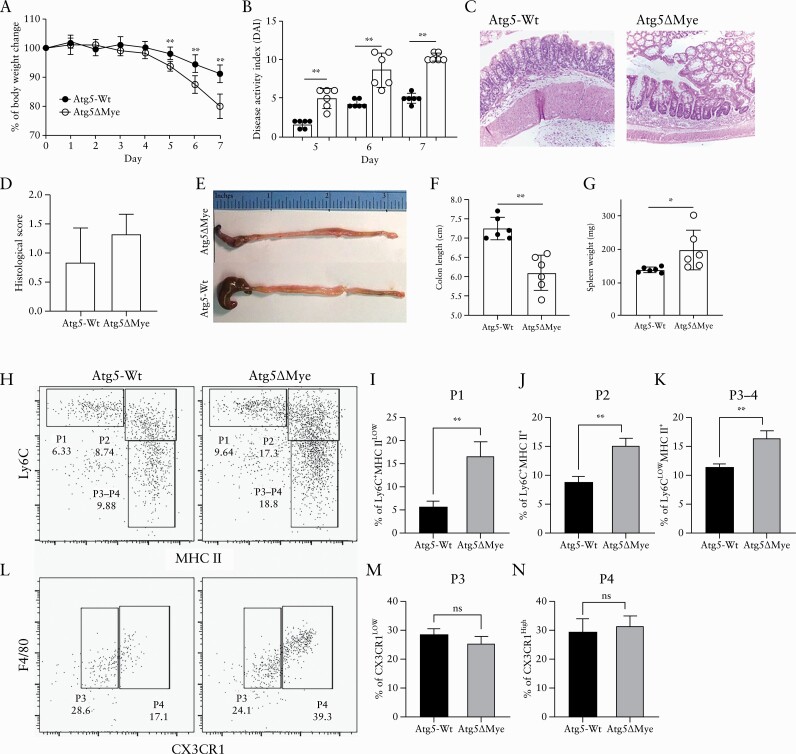
Figure 2.
Myeloid Atg5 expression prevents excessive DSS-induced colitis and an accumulation of lamina propria myeloid cells. DSS-induced colitis and myeloid cell response in Atg5-Wt and Atg5ΔMye mice. [A] Percent weight loss between Atg5-Wt and Atg5ΔMye mice. [B] Disease activity index [DAI] as determined by weight loss, behaviour, acute diarrhoeal response, and mucosal bleeding. [C] H&E staining of colon sections. [D] Histological scores. [E] Representative gross anatomy of the caecum and colon of colitic Atg5-Wt and Atg5ΔMye mice. [F] Colon length after colitis. [G] Spleen weight after colitis. [H] Dot plots showing lamina propria [gated on CD45+CD11b+ cells] monocyte waterfall as determined by Ly6C and MHC II staining after colitis. [I] Graph showing percent of P1 [Ly6C+MHC IILow] cells. [J] Graph showing percent of P2 [Ly6C+MHC II+] cells. [K] Graph showing percent of P3-4 [Ly6CLowMHC II+] cells. [L] Dot plots showing F4/80 expression and CX3CR1 expression on P3-P4 gated cells in H. [M] Graph showing percent of P3 [Ly6CLowMHC II+CX3CR1Low] cells. [N] Graph showing percent of P4 [Ly6CLowMHC II+CX3CR1+] cells. Representative of three independent experiments, Graphs indicate mean [±SD]; *p <0.05, **p <0.01. Two-tailed unpaired Student’s t tests or by two-way ANOVA with Tukey’s post hoc test. DSS, dextran sodium sulphate; H&E, haematoxylin and eosin; SD, standard deviation; ANOVA, analysis of variance.

