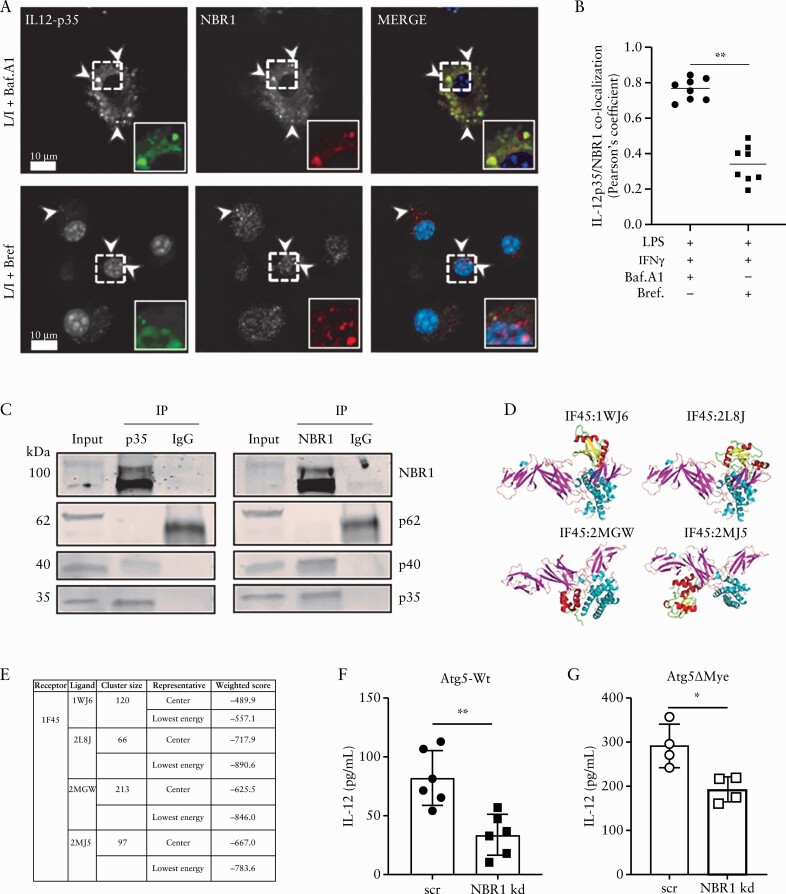
Figure 5.
NBR1 and IL-12 interaction. Analysis of NBR1 and IL-12 interaction in macrophages. [A] Atg5-Wt BMM were stained for NBR1 [red] and IL-12p35 [green] after LPS and IFNγ stimulation and the addition of Bafilomycin A1 [top row] or Brefeldin A [bottom row]. [B] Quantification was performed using Pearson’s correlation coefficient [co-localisation] using image analysis. Representative of two independent of experiments and of 10 images from five slides. Arrows in images indicate puncta co-localising with insets displaying enlargement of indicated region. Scale bars: 10 µm. [C] Anti-IL-12p35 antibody co-immunoprecipitated NBR1 and IL-12p40, and anti-NBR1 antibody co-immunoprecipitated IL-12p35 and IL-12p40. [D and E] Protein docking between IL12A [PDB ID: 1F45] and NBR1. [D] The docking models and [E] ClusPro docking results for four candidate interaction models between 1F45 and four peptide fragments of NBR1 [PDB IDs: 1WJ6, 2L8J, 2MGW, and 2MJ5]. [F and G] Effects of NBR1 knockdown on IL-12 secretion in Atg5-Wt or Atg5ΔMye BMM. Graphs indicate mean [±SD]. * p < 0.05, **p < 0.01. Two-tailed unpaired Student’s t tests. BMM, bone marrow-derived macrophages; LPS, lipopolysaccharide; SD,standard deviation.

