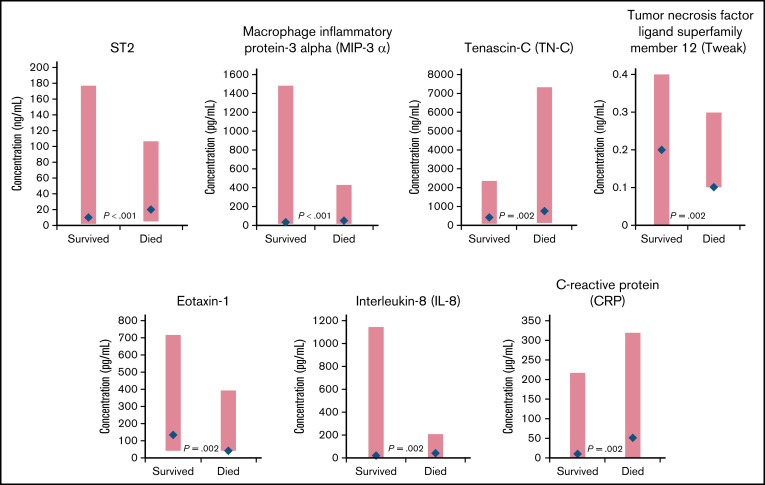
Figure 2.
Biomarkers with significantly different distributions (red bar) and largest differences between median values (blue diamond) at baseline for cancer patients who survived vs those who died during the CASSINI study. P determined from a Wilcoxon rank-sum test, unadjusted for multiple comparisons, comparing the 2 distributions.

