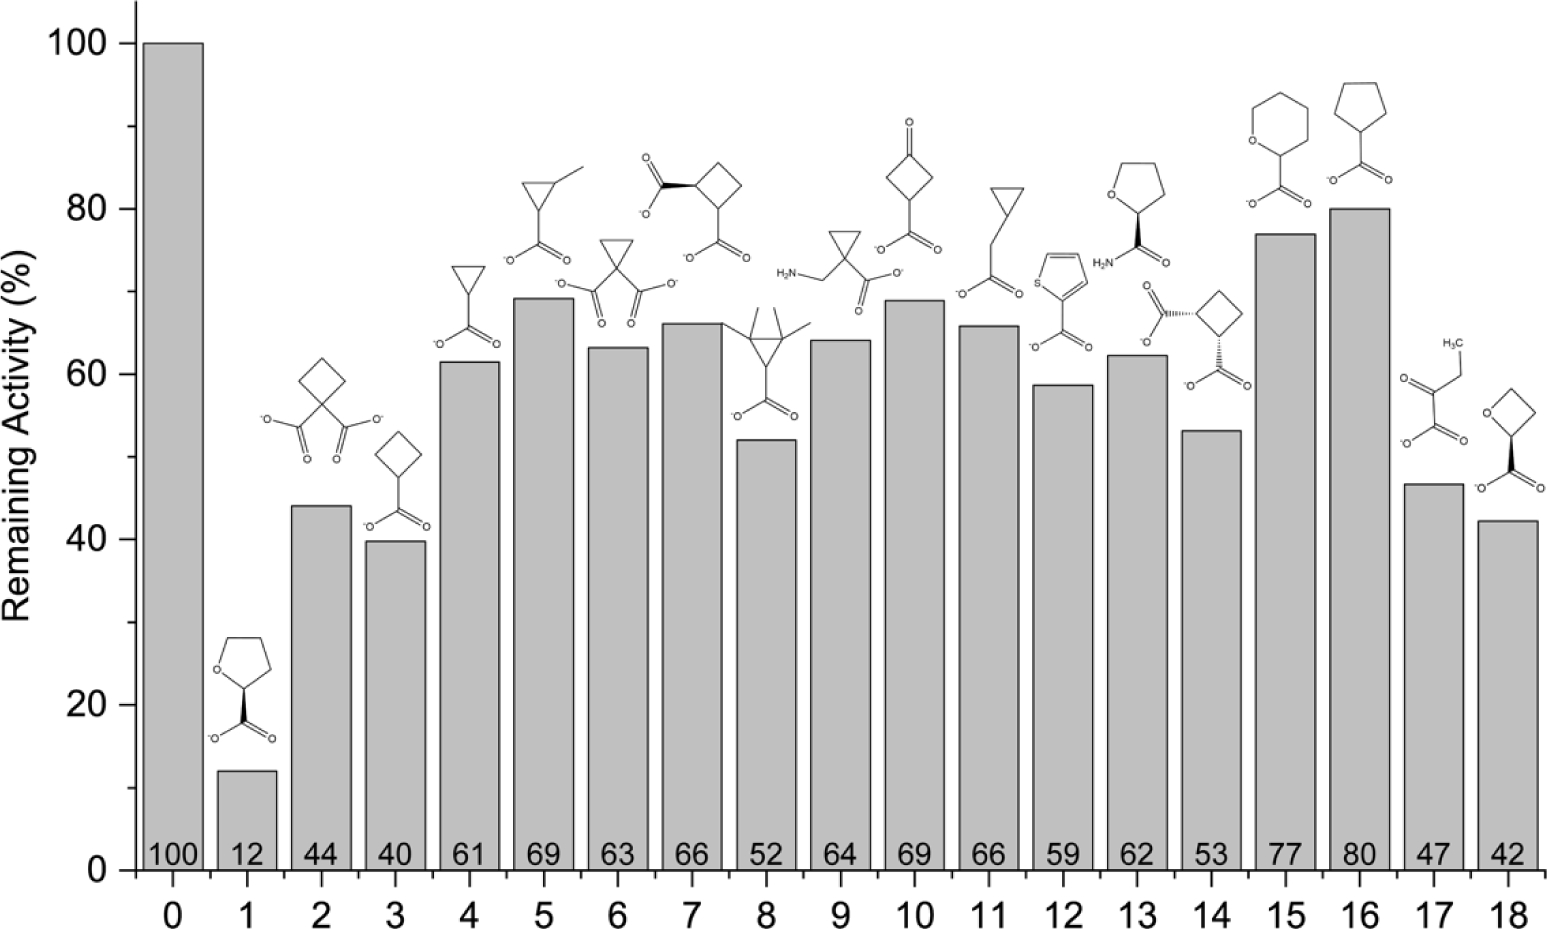
Fig. 3.

Initial screening of compounds for inhibition of PRODH activity. The bars represent the enzyme activity of PutA86–630 measured at a single L-proline substrate concentration (200 mM) and the compound present at 5 mM. The data are normalized to the activity in the absence of any inhibitor (compound 0). Compound 1 was included as a positive control. The percent activity relative to the no-inhibitor control is labeled above the x-axis.
