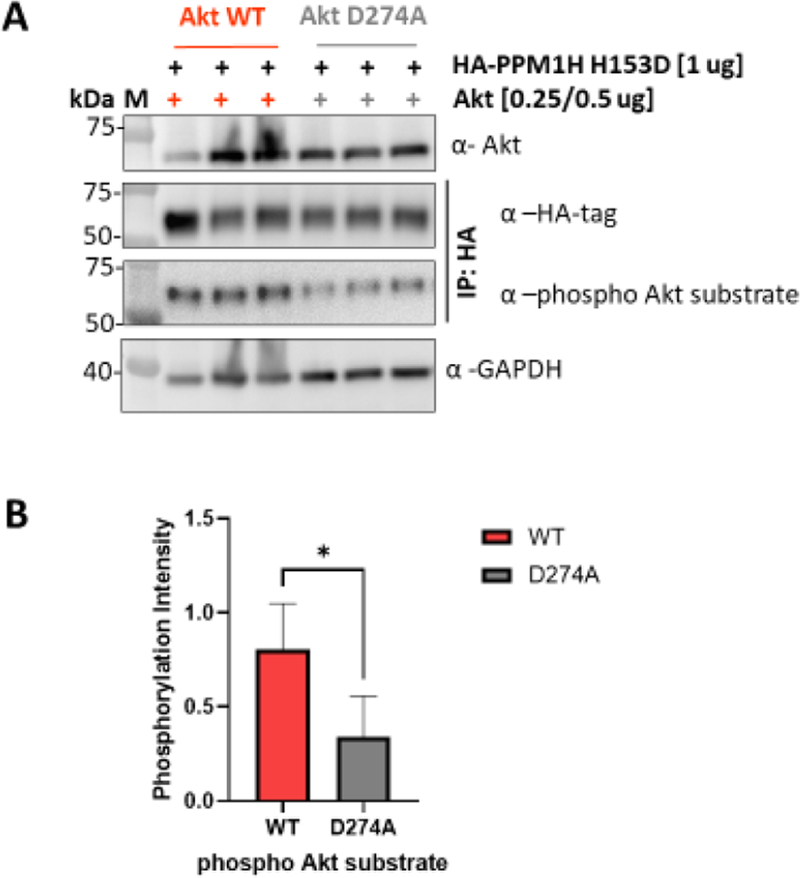
Figure 4.
Akt phosphorylates PPM1H in HCT116 Akt1/2 KO cells. (A) Western blot analysis of HCT116 Akt1/2 KO cells transfected with either WT (left) or D274A (catalytically dead, right) Akt and PPM1H (H153D) showing three different replicates. Anti-Akt (1:2000) and Anti-GAPDH (1:5000) were blotted from cell lysates. Anti-HA-tag (1:1000) and Anti-phospho Akt substrates (1:1000) were blotted from lysates that were immunoprecipitated with HA-tag magnetic beads (see the Methods). (B) Bar plot represents quantification of band intensity of WB for phosphorylated Akt substrate forms normalized to total HA-tag bands intensity for each band. Data represent five biological replicates with n = 2 or 3 for each. The P-value is 0.0128.

