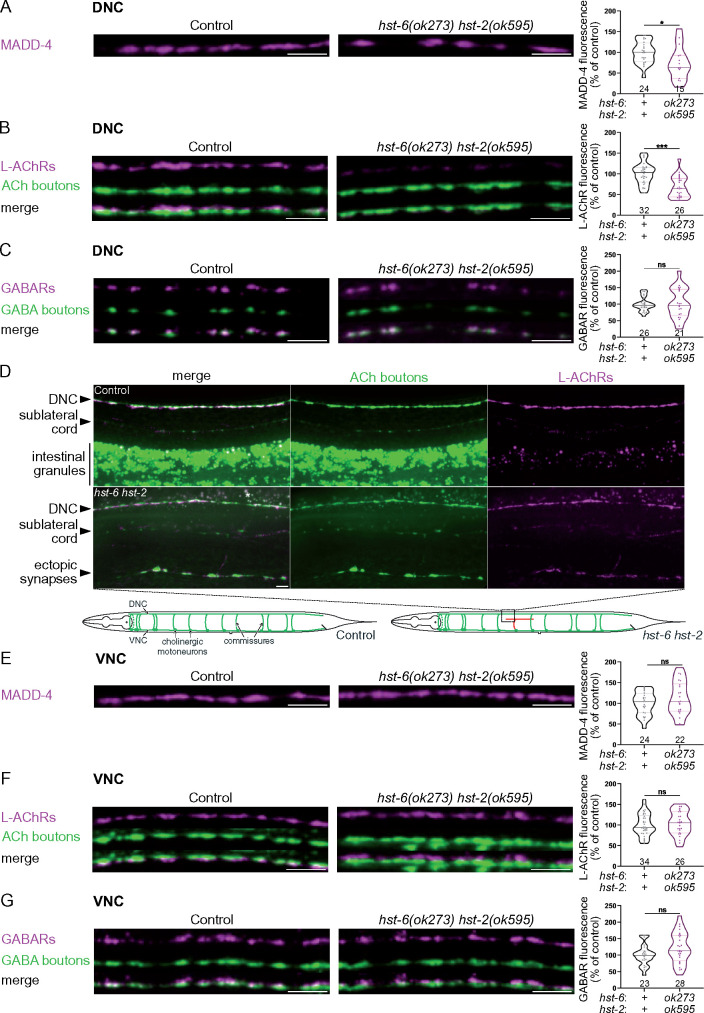
Figure 4.
Postsynaptic NMJ organization is unchanged in hst-2 hst-6 double mutants. (A) Confocal images of MADD-4-tagRFPt knock-in (magenta) at the DNC of control and hst-6(ok273) hst-2(ok595) worms. Quantifications show the MADD-4 fluorescence intensity at DNC in each genotype and results of Mann–Whitney test. (B) Confocal images of L-AChRs (UNC-29-tagRFPt knock-in, magenta) and cholinergic (ACh) boutons (SNB-1-BFP, green) at the DNC of control and hst-6(ok273) hst-2(ok595) worms. Quantifications show the L-AChR fluorescence intensity at DNC in each genotype and results of Mann–Whitney test. (C) Confocal images of GABARs (UNC-49-tagRFPt knock-in, magenta) and GABA boutons (SNB-1-GFP, green) at the DNC of control and hst-6(ok273) hst-2(ok595) worms. Quantifications show the GABAR fluorescence intensity at DNC in each genotype and results of Mann–Whitney test. (D) Confocal images of L-AChRs (UNC-29-tagRFPt knock-in, magenta) and cholinergic (ACh) boutons (SNB-1-BFP, green) in controls (top panels) and hst-6(ok273) hst-2(ok595) worms (bottom panels), showing an example of commissures that did not reach the DNC and formed ectopic synapses outside the main and sublateral cords. * Indicates autofluorescent signal coming from intestinal granules as the intestine is located below the DNC in this image. The schematics show an example of defect of cholinergic motoneurons projections: in the control, cholinergic motoneurons are located ventrally and project axons in the VNC, as well as commissural axons toward the DNC. In hst-6(ok273) hst-2(ok595) mutants, commissural axons sometimes fail to reach the DNC and can form ectopic synapses, as illustrated here in red. The black square indicates the approximate location of the image shown above. (E) Confocal images of MADD-4-tagRFPt knock-in (magenta) at the VNC of control and hst-6(ok273) hst-2(ok595) worms. Quantifications show the MADD-4 fluorescence intensity at VNC in each genotype and results of Mann–Whitney test. (F) Confocal images of L-AChRs (UNC-29-tagRFPt knock-in, magenta) and cholinergic (ACh) boutons (SNB-1-BFP, green) at the VNC of control and hst-6(ok273) hst-2(ok595) worms. Quantifications show the L-AChR fluorescence intensity at VNC in each genotype and results of Mann–Whitney test. (G) Confocal images of GABARs (UNC-49-tagRFPt knock-in, magenta) and GABA boutons (SNB-1-GFP, green) at the VNC of control and hst-6(ok273) hst-2(ok595) worms. Quantifications show the GABAR fluorescence intensity at VNC in each genotype and results of Mann–Whitney test. Scale bars, 5 µm.

