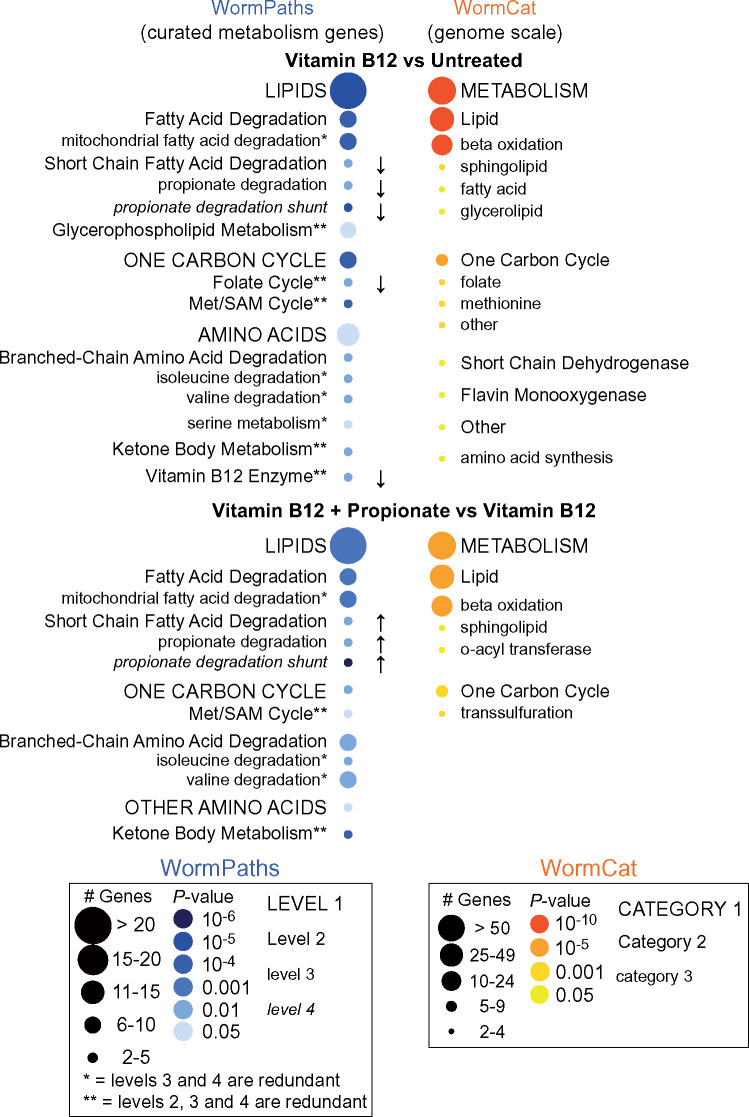
Figure 6.
Pathway enrichment analysis using WormPaths levels. Pathway enrichment analysis using a previously published RNA-seq dataset of C. elegans untreated, treated with 20nM vitamin B12, or treated with 20nM vitamin B12 and 40mM propionate with a p-adjusted of ≤0.05 and a fold change of ±1.5 shows enrichment of lipids and one-carbon cycle pathways (left, blue). The arrows indicate the directionality of differentially expressed genes. No arrow indicates both increased and decreased gene expression. WormPaths enrichment for curated metabolic genes complements and adds resolution to the genome scale enrichment metabolic results from WormCat (right, orange).

