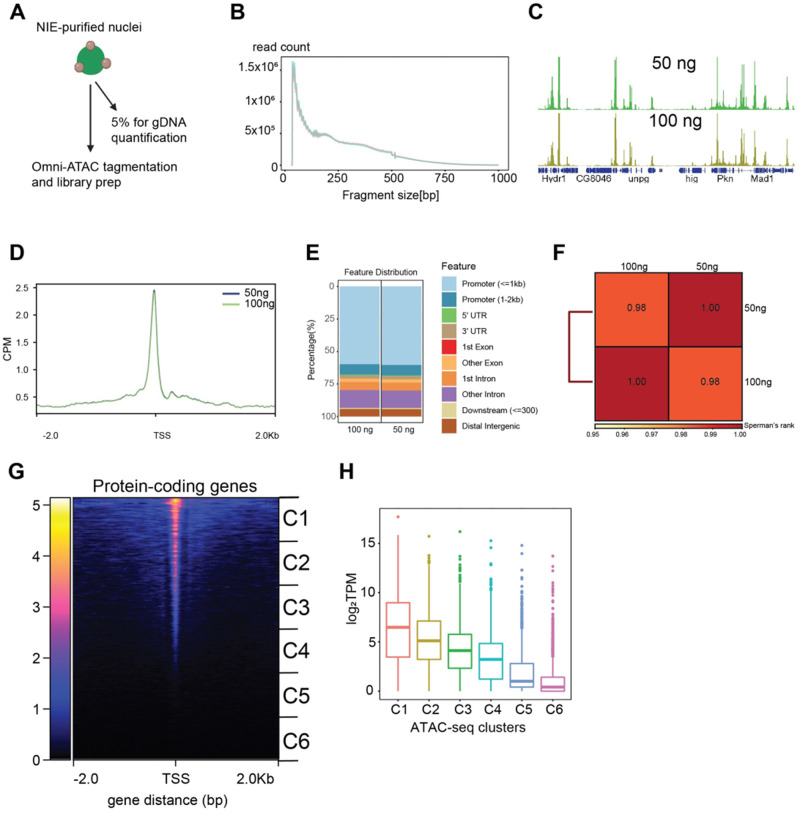
Figure 3.
Profiling chromatin accessibility (Omni-ATAC) in NIE-purified nuclei. (A) Diagram depicting Omni-ATAC approach applied to NIE-purified nuclei. After NIE purification, a fraction of nuclei is used for genomic DNA extraction and quantification to determine the input material for Omni-ATAC. Nuclei remain on ice until tagmentation, followed by two washes with tagmentation buffer without Tn5 enzyme. Upon washes, nuclei are tagmented using standard ATAC-seq conditions. (B) Fragment size distribution of Omni-ATAC libraries using 50 ng (light green) or 100 ng (light red) as starting material. (C) Genome browser views of CPM-normalized Omni-ATAC signal with genes shown in blue. (D) Metaplot of CPM-normalized Omni-ATAC signal around the transcription start site (TSS) averaged for all protein-coding genes in the 50 and 100 ng samples. (E) Genomic distribution of accessible peaks of 50- and 100 ng- associated dataset. (F) Spearman correlation heatmap of Omni-ATAC read distribution over binned genome. Scores between 0 and 1 shown in each box correspond to Spearman’s rank score. (G) Heatmap showing CPM-normalized Omni-ATAC signal around TSS of protein-coding genes of 100 ng-associated dataset. Clusters used for transcript boxplot are highlighted. (H) Boxplot showing log2-transformed TPM scores for each cluster defined in 3G.

