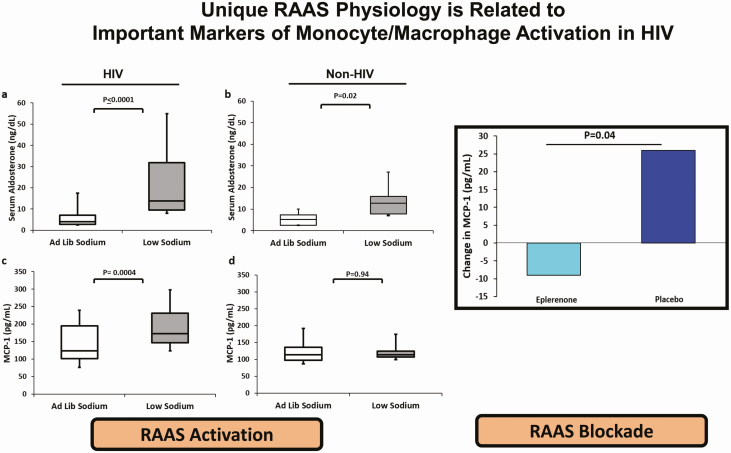
Figure 3.
Left figure: Study of RAAS activation. Comparison of the serum aldosterone (ng/dL) and MCP-1 (pg/mL), marker of immune activation during ad libitum and low-sodium diets in persons with (A and C) and persons without (B and D) HIV. Box plot represents the 25th and 75th percentiles, and lines within the boxes represents medians. Adapted from Srinivasa et al (44). Right figure: Study of RAAS blockade. Absolute between-group change of MCP-1 (pg/mL) after 6 months treatment of eplerenone vs placebo among PWH. Adapted from Srinivasa et al (82) with permission from the Endocrine Society.

