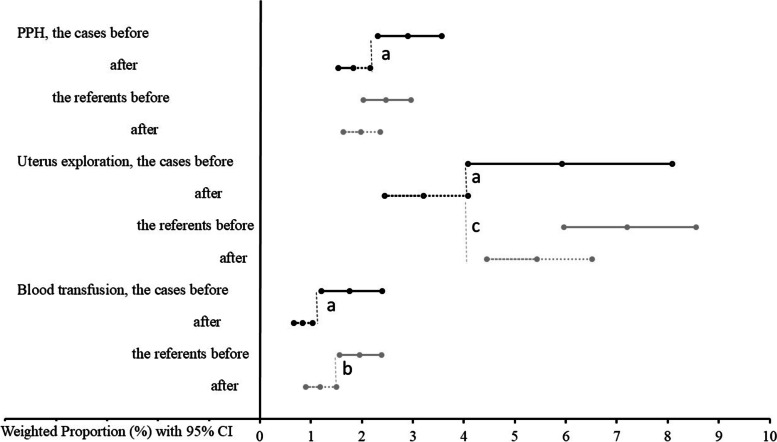
Fig. 3.
Weighted average rates of postpartum hemorrhage and related activities on regional scale after staff training
Weighted average indices calculated using meta-analyses framework for the cases (n=28) and the referents (n=36), before and after the training with 95%CIs (the whiskers). Black lines represent indices’ values for the cases and grey lines - for the referents. Solid lines indicate groups “before”, dotted lines – “after” the training. P<0.05 for the difference of a the cases before compared with the cases after, b the referents before and after, c the cases and the referents after the training. CI: confidence interval

