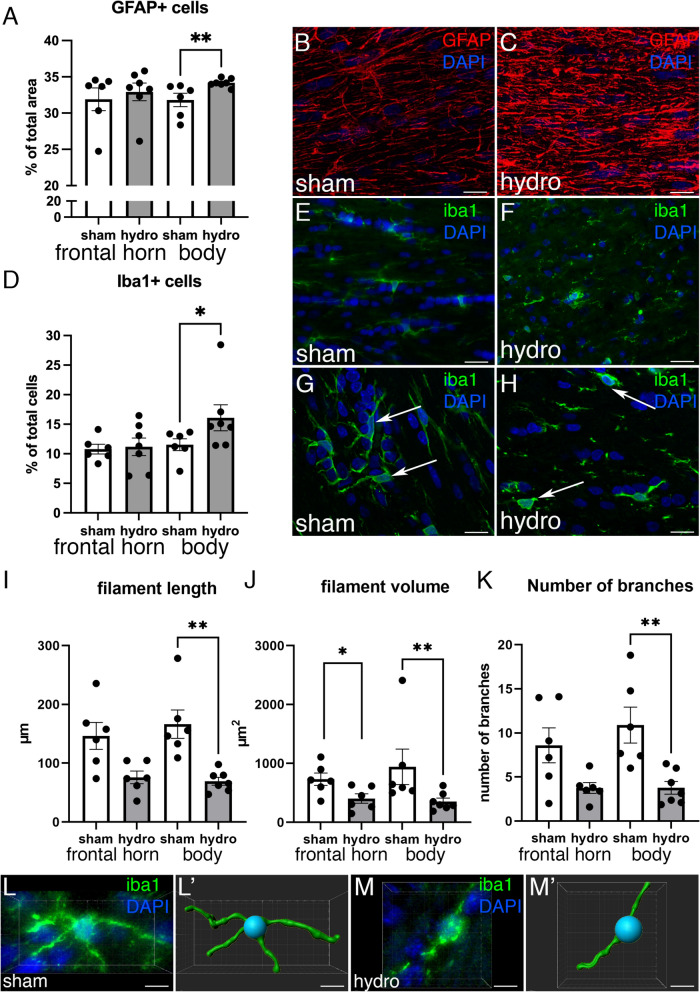
Fig. 6.
Analysis of the astroglia and microglia reaction in the PVWM after the induction of hydrocephalus. A Density of GFAP+ cells (percentage of the area occupied by astrocytes respect to the total measured area) was increased in the PVWM adjacent to the body of the lateral ventricles, but not in the frontal horn, in the hydrocephalic pigs. Representative images used for quantification for GFAP labeling (red) in paraffin sections of the PVWM from B a sham control and C a hydrocephalic pigs. Magnifications are the same. D Density of Iba1+ cells (percentage of microglial cells per total number of cells) was also increased in the PVWM adjacent to the body of the lateral ventricles in hydrocephalic pigs. Representative images used for quantification for Iba1 labeling (green) in the PVWM from E sham control and F hydrocephalic pigs. Magnifications are the same. Microglia was reactive in the hydrocephalic condition as illustrated in the details of G healthy Iba1+ cells (green) in a sham pig, and H in a hydrocephalic animal (white arrows). The filament length (I), volume (J), and number of branches (K) were reduced in the hydrocephalic pigs. Representative images from an immunofluorescence and its 3D reconstruction of a microglial cells from the PVWM adjacent to the body in a sham control (L, L′) and a hydrocephalic pig (M, M′). Scale bars represent 30 µm in B, C, E, F; 15 µm in G, H; and 8 µm in L–M′. Images were obtained under the confocal microscope, and a Z-stack of 10 µm was composed with ImageJ software in B, C, E, F. 1-µm thickness images are shown in G and H. **p = 0.035 for GFAP, *p = 0.035 for Iba1, **p = 0.0012 filament length, *p = 0.0411 **p = 0.0082 filament volume, **p = 0.0029 number of branches in the analysis of Iba1 morphology, Wilcoxon–Mann–Whitney test

