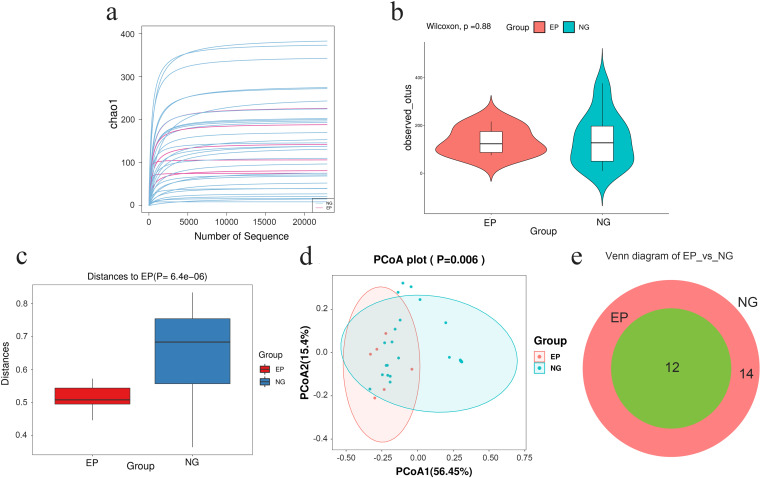
Fig. 1.
Preliminary comparison of the diversity of gut microbiota between the EP group and the NG group. a The quantities and differences of ASVs among the samples are directly shown in the rarefaction curves of the Chao1 index, which tend to flatten and suggest the sufficiency and reasonableness of the sequences. b The boxplot of the Shannon index shows that there was no significant difference in ASV diversity between the EP group and NG (p = 0.88). c Analysis of similarities (ANOSIM) (p < 0.001) indicated that the between-sample discrepancies in microbial structure were significant. d Principal coordinate analysis (PCoA) with weighted UniFrac distances (p = 0.006) shows that the distance between two points indicates a significant difference in community composition. PCoA1 and PCoA2 are used to plot the coordinate axis, and the percentages refer to the extent of variation explained. e The Venn diagram intuitively presents the number of common and exclusive ASVs between the EP group and the NG group calculated using R software

