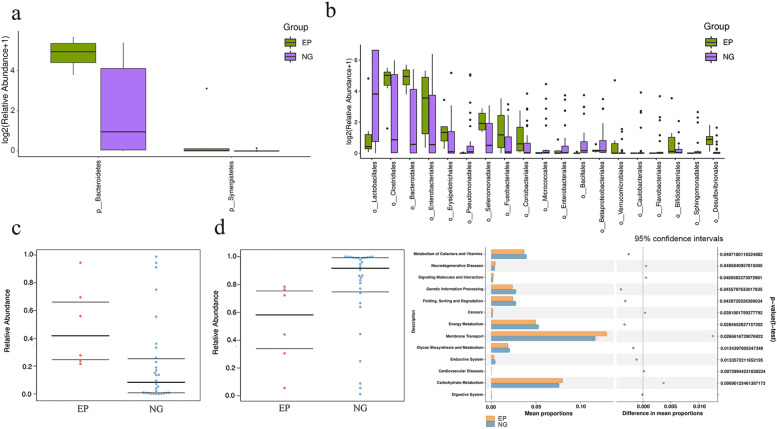
Fig. 3.
a Bacteroidetes and Synergistetes were significantly increased in the EP group at the phylum level (p < 0.05) (b). Bacillales and Lactobacillales were significantly decreased in the EP group at the order level (p < 0.05). c Phenotype prediction showed that Gram-negative status was significantly increased in the EP group (P = 0.013). d Phenotype prediction showed that the Gram-positive status was significantly decreased in the EP group (P = 0.013). e The KEGG pathway analysis of the second level was compared with metabolic analysis between the EP group and the NG. (1). For the left half of the graph, the Y axis represents the KEGG pathways of levels. The length of the column indicates the KO abundance in the pathway. (2). For the right half of the graph, the X axis represents the confidence interval of the difference in species abundance, and the Y axis represents the P value. KEGG: Kyoto encyclopedia of genes and genomes

