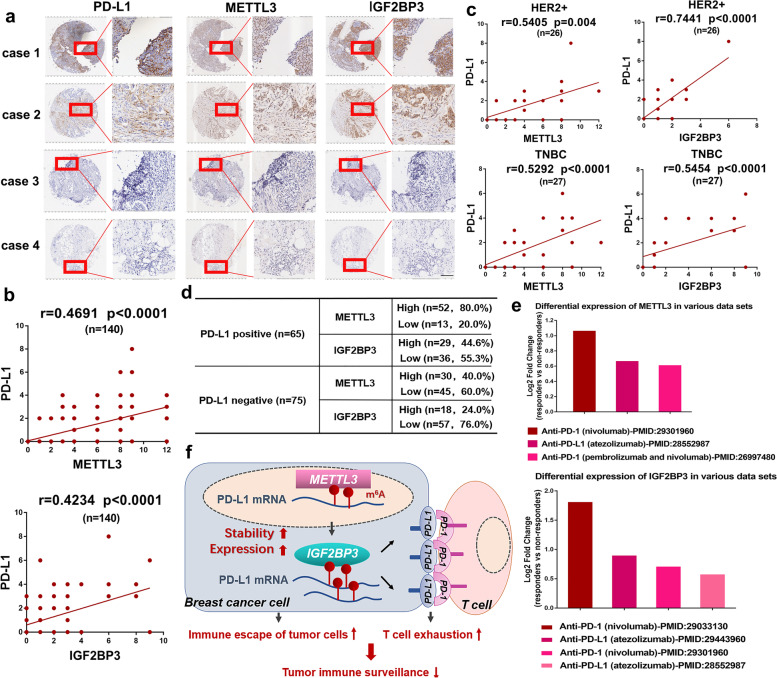
Fig. 6.
PD-L1 expression positively correlates with METTL3 and IGF2BP3 expression in breast cancer. a The expressions of PD-L1, METTL3 and IGF2BP3 were analyzed by IHC in a tissue microarray containing of 140 breast cancer tissues. Four Cases as representative IHC staining with positive- and negative-PD-L1 were shown. Scale bars, 100 μm. b The correlation of PD-L1 with METTL3 and IGF2BP3 in all breast cancer tissues (n = 140) were analyzed by IHC scores. Proportion scores were recorded as 0, 1, 2, 3, 4 corresponding to < 5%, 5–25%, 25–50%, 50–75%, and ≥ 75%. Intensity scores were recorded as 0, 1, 2, 3 corresponding to negative, weak, moderate, and strong staining. Finally, IHC scores was calculated as “proportion score × intensity score”. c The correlation between PD-L1 and METTL3 or IGF2BP3 were analyzed in HER2+ (n = 26) and TNBC (n = 27) subtypes. Spearman’s rank correlation test was used to analyze the P value. d Number of cases of METTL3 and IGF2BP3 were presented in two categories (PD-L1 positive and PD-L1 negative) in 140 tissues. e The differential expression of METTL3 or IGF2BP3 between responders and non-responders in cilnial data sets. The Y-axis represents the log2 Fold change values (responders vs. non-responders). f A schematic model illustrating the mechanism of METTL3/IGF2BP3-mediated N6-methyladenosine modification of PD-L1 mRNA in breast cancer

