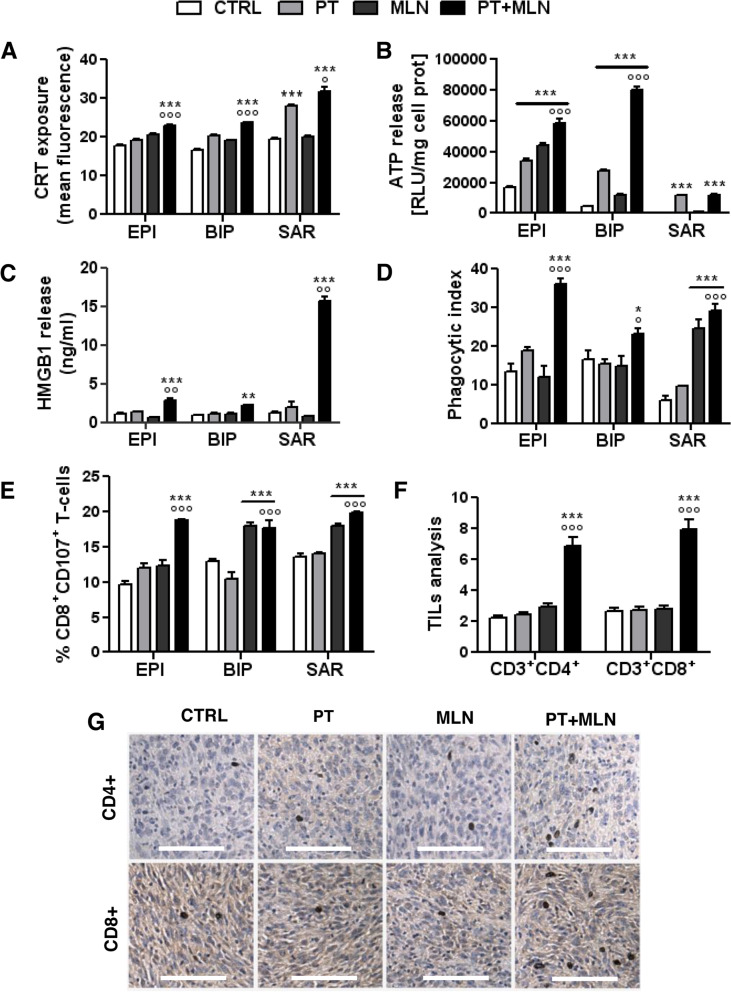
Fig. 4.
MLN4924 in combination with cisplatin effectively restored immunogenic cell death in resistant mesothelioma cells. Primary MPM cells derived from 3 different histopathological subtypes, epithelioid (EPI BAP1+ UPN7 and EPI BAP1- UPN11), biphasic (BIP BAP1+ UPN14 and BIP BAP1- UPN16) and sarcomatous (SAR BAP1+ UPN22 and SAR BAP- UPN23) were incubated in fresh medium (CTRL), with 50 μM cisplatin (PT), 0.2 μM MLN4924 (MLN) or their combination (PT+MLN) for 24 h Panels A-B) or 48 h (panel C). A. Calreticulin (CRT) exposure on the plasma membrane was measured by flow cytometry in duplicates. Data are expressed as means of 2 primary MPM for each histopathological subtype used + SD (n = 3). ***p < 0.001: treated cells vs CTRL cells; °p < 0.05, °°°p < 0.001: PT+MLN-treated cells vs PT-treated cells. B. ATP release was measured by a chemiluminescence-based assay in duplicates. Data are expressed as means of 2 primary MPM for each histopathological subtype used + SD (n = 3). ***p < 0.001: treated cells vs CTRL cells; °°°p < 0.001: PT+MLN-treated cells vs PT-treated cells. C. HMGB1 release was measured by ELISA in duplicates. Data are expressed as means of 2 primary MPM for each histopathological subtype used + SD (n = 3). **p < 0.01, ***p < 0.001: treated cells vs CTRL cells; °°p < 0.01: PT+MLN-treated cells vs PT-treated cells. D. Phagocytosis by dendritic cells was measured by flow cytometry in duplicates. Data are expressed as means of 2 primary MPM for each histopathological subtype used + SD (n = 3). *p < 0.05, ***p < 0.001: treated cells vs CTRL cells; °p < 0.05, °°°p < 0.001: PT+MLN-treated cells vs PT-treated cells. E. CD8+CD107a+ lymphocytes, collected after co-culture with dendritic cells that have phagocytized MPM cells, were quantified by flow cytometry, in duplicates. Data are expressed as means of 2 primary MPM for each histopathological subtype used+ SD (n = 3). ***p < 0.001: treated cells vs CTRL cells; °°°p < 0.01: PT+MLN-treated cells vs PT-treated cells. F-G. AB1 tumors were subcutaneously implanted into 6-week-old female BALB/c mice when the tumor size reached 50 mm3 mice (n = 10 animals/group) were treated for 3 consecutive as indicated in the Methods section. F. Percentage of CD4+/CD8+ intratumor T-lymphocytes (TILs) collected after tumor digestion and analyzed by flow cytometry, in duplicates. Data are means + SD. ***p < 0.001: treated group vs CTRL group; °°°p < 0.001: PT+MLN-treated cells vs PT-treated cells. G. Representative immunohistochemical imaging of CD4+ and CD8+ TILs. Scale bar: 100 μm. (10x ocular, 40x objective). At least 10 fields were examined for each condition

