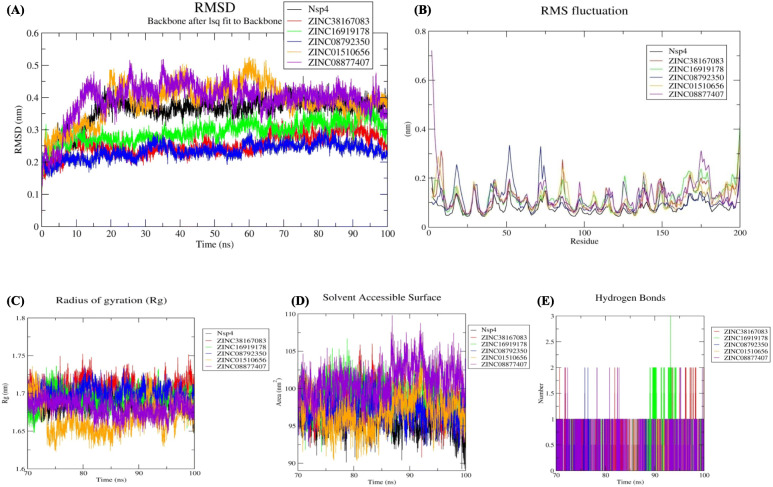
Fig. 2.
Stability analysis (A) RMSD values for the Nsp4–compound complexes. Flexibility analysis (B) RMSF values for the Nsp4–compound complexes over the final 30 ns of the simulations. Compactness (C) Rg, and Solvent accessible surface area analysis (D) SASA values for the final 30 ns of the simulations. Black, red, green, blue, orange, and violet colours represent Nsp4, Nsp4-ZINC38167083, Nsp4-ZINC16919178, Nsp4-ZINC08792350, Nsp4-ZINC01510656, and Nsp4-ZINC08877407, respectively. E Changes in the number of hydrogen bonds in each respective complex according to data from the final 30 ns of the simulations. Red, green, blue, orange, and violet colour represent Nsp4-ZINC38167083, Nsp4-ZINC16919178, Nsp4-ZINC08792350, Nsp4-ZINC01510656, and Nsp4-ZINC08877407 respectively

