
FIGURE 1.
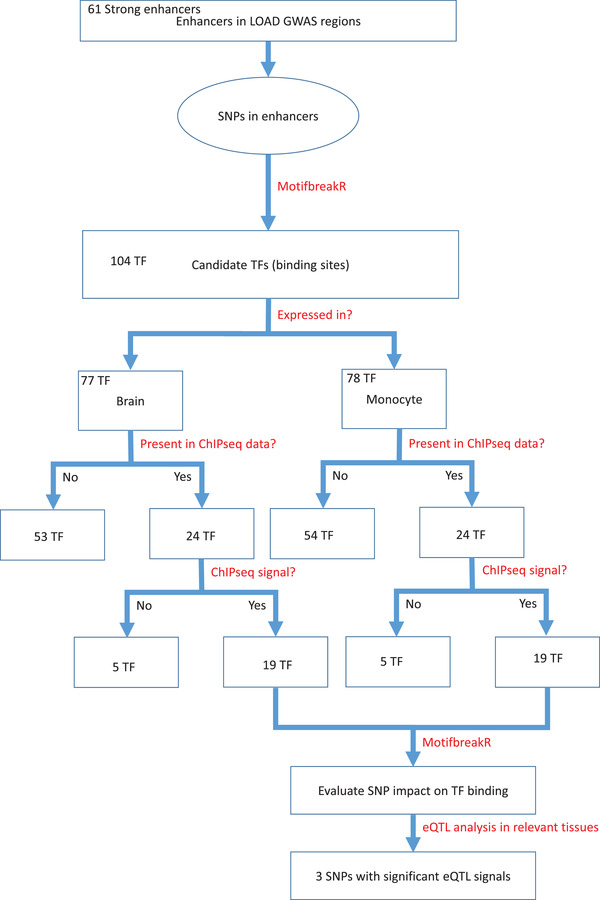
A schematic of the bioinformatics pipeline. Flowchart illustrating the analytical scheme used to progress from SNPs located in enhancers within LOAD GWAS regions to a filtered set of SNPs that have a predictive regulatory effect on transcription in disease relevant tissues. eQTL, expression quantitative trait loci; GWAS, genome‐wide association study; LOAD, late‐onset Alzheimer's disease; SNP, single nucleotide polymorphism; TF, transcription factor