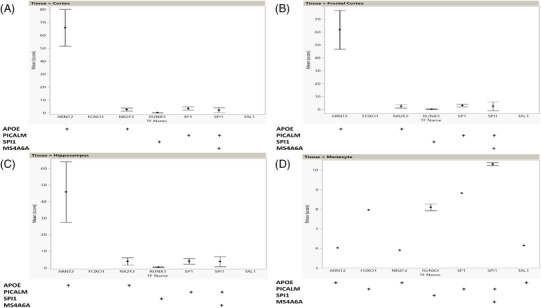
FIGURE 6.

Expression profiles of TFs in specific brain tissues and monocytes. The TFs presented here were identified to have disrupted binding site/s in the four examples of LOAD GWAS genomic loci (APOE, PICALM, SPI1, and MS4A6A). Calculation of score is described in Methods. The matrix under each expression plot identifies each LOAD GWAS locus by the name of the proximal gene. A + symbol in the matrix indicates that the TF labelled on the X axis (column heading) is expressed at each of the loci (row label at left): (A) brain, temporal cortex; (B) brain, frontal cortex; (C) brain, hippocampus; (D) monocytes. GWAS, genome‐wide association study; LOAD, late‐onset Alzheimer's disease; SNP, single nucleotide polymorphism; TF, transcription factor
