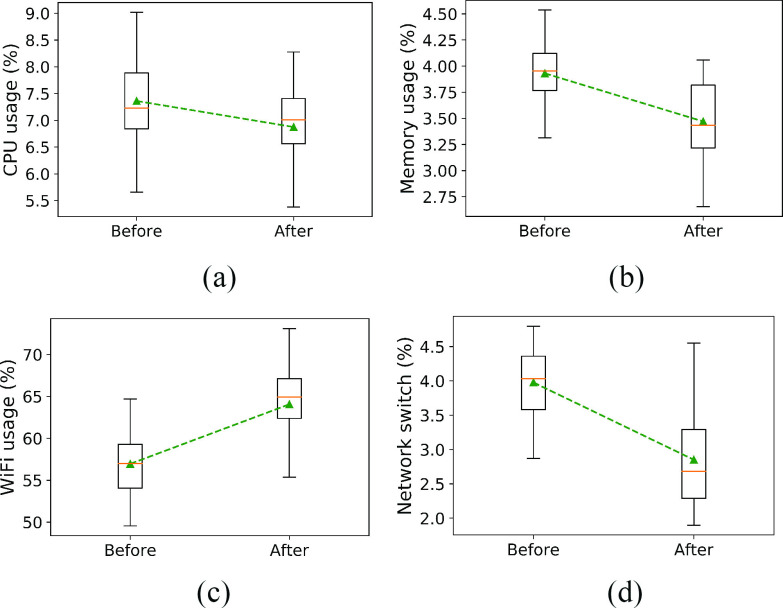
Fig. 3.
Differences in smartphone usage before and after the outbreak of Covid-19. (a) Distributions of the percentage of CPU usage,
 . (b) Distributions of the percentage of memory usage,
 . (c) Distributions of the percentage of WiFi usage,
 . (d) Distributions of the percentage of network switches,
 .
.

