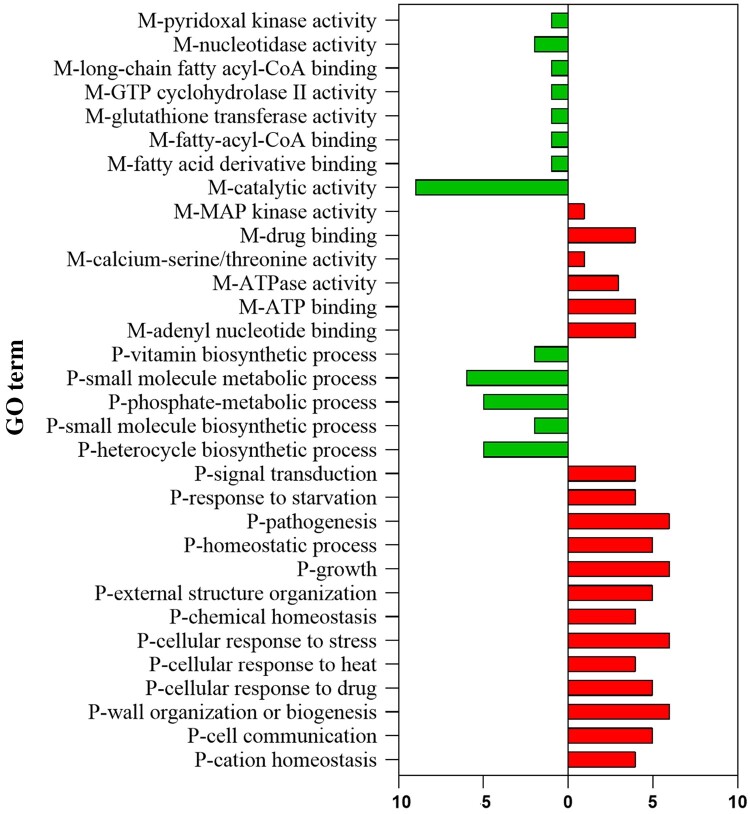
Figure 2.
Gene Ontology (GO) analysis of the proteins considered differentially abundant after caspofungin treatment (>1.5-fold change and p-value <0.05). M indicates a molecular function; P indicates a biological process; the x-axis indicates the number of associated proteins. This figure appears in colour in the online version of JAC and in black and white in the print version of JAC.

