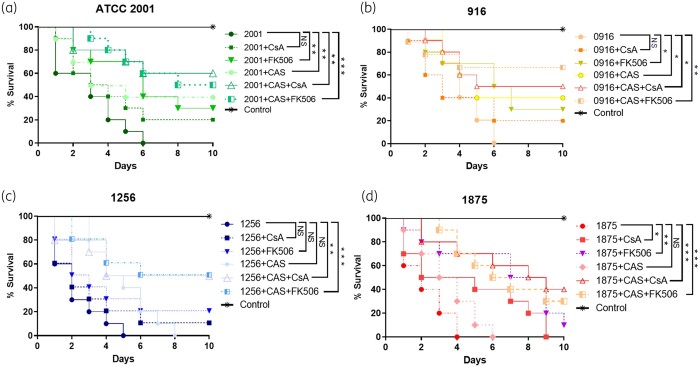
Figure 7.
Galleria time–kill curves of caspofungin-susceptible (a, b) and resistant (c, d) C. glabrata isolates exposed to, caspofungin (1 μg/larva), calcineurin inhibitors (15 mg/L) and their combinations. The data are expressed as the percentages of survival. Log-rank (Mantel–Cox) test with P values of <0.05 was used to indicate statistical significance as follows: *P < 0.05, **P < 0.02 and ***P < 0.001.

