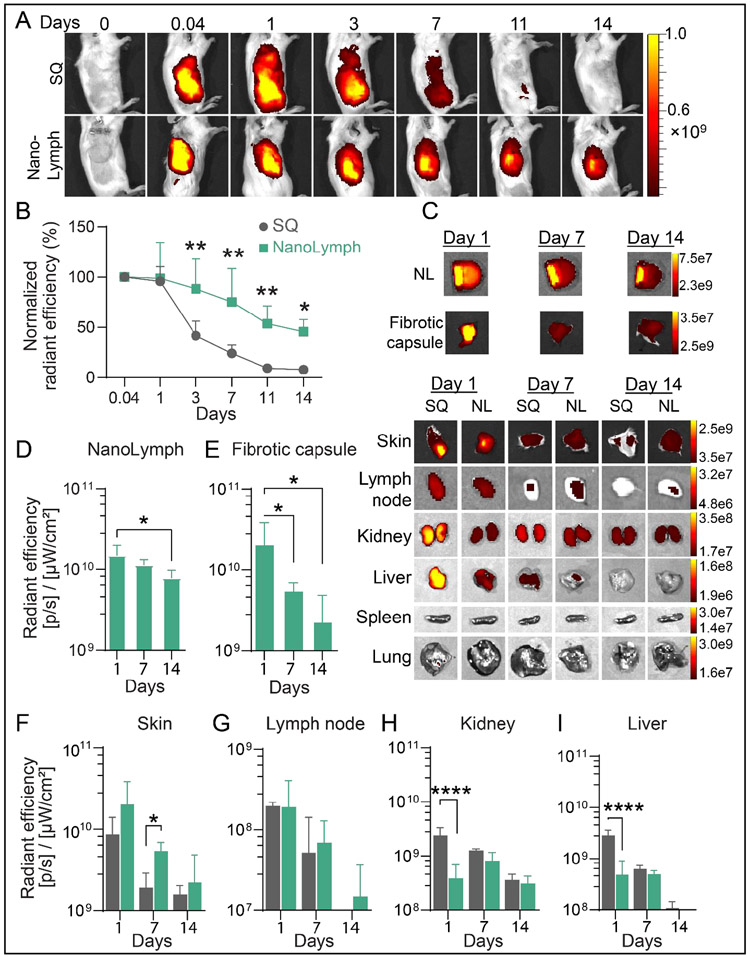
Figure 6: Drug retention within NanoLymph.
(A) IVIS analysis of Cy7-Ca in drug reservoir of implanted NanoLymph compared to injected subcutaneous (SQ) control in mice. (B) Normalized relative radiance analysis by IVIS of Cy7-CA comparing SQ (gray, circle) to NanoLymph drug reservoir (teal, sqare) across time points in vivo. (C) Ex vivo IVIS images of Cy7-Ca in organs comparing NanoLymph (NL) to bolus injected SQ. Relative radiance analysis by IVIS of Cy7-CA in (D) NanoLymph, (E) fibrotic capsule and (F) skin surrounding implant. (F) Relative radiance analysis by IVIS of Cy7-CA in (G) inguinal lymph node, (H) kidney and (I) liver. *P ≤ 0.05, **P ≤ 0.01 and ***P ≤ 0.001. Graphs are plotted as mean ± SD. Statistical significance determined via two-way ANOVA.

