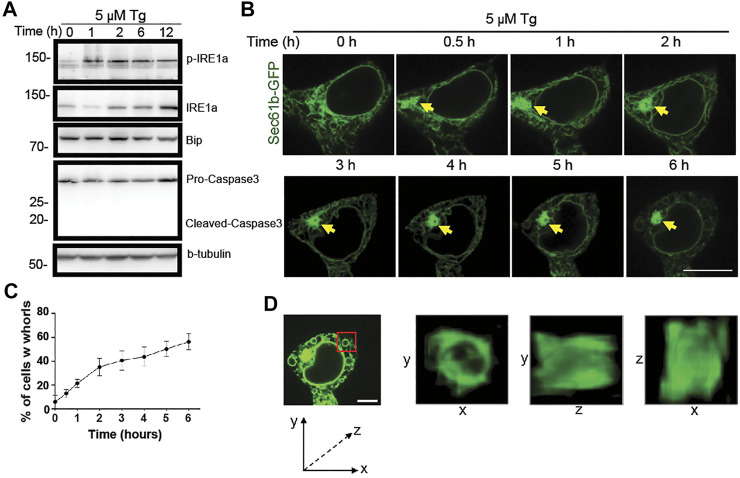
FIGURE 2.
Progressive changes of ER structure under ER stress over time. (A) Immunoblot analysis of p-IRE1 , IRE1 , caspase3 (pro and cleaved) and β-tubulin from cell lysates after treatment of HEK293T cells with DMSO or 5 M Tg for the indicated durations. (B) Representative ER structures labeled with GFP-Sec61 (green) in HEK293T cells treated with 5 M Tg for the indicated durations. Yellow arrows point to where initial formation and evolution of an ER whorl occur. Scale bar: 20 m. (C) Percentages of HEK293T cells with ER whorls after treatment with 5 M Tg for the indicated durations. Data were presented as mean ± SD from three independent experiments. (D) 5 magnified 3D views of the ring-like ER whorl in the region marked by the red box in the leftmost sub-panel. Scale bar: 10 m.

