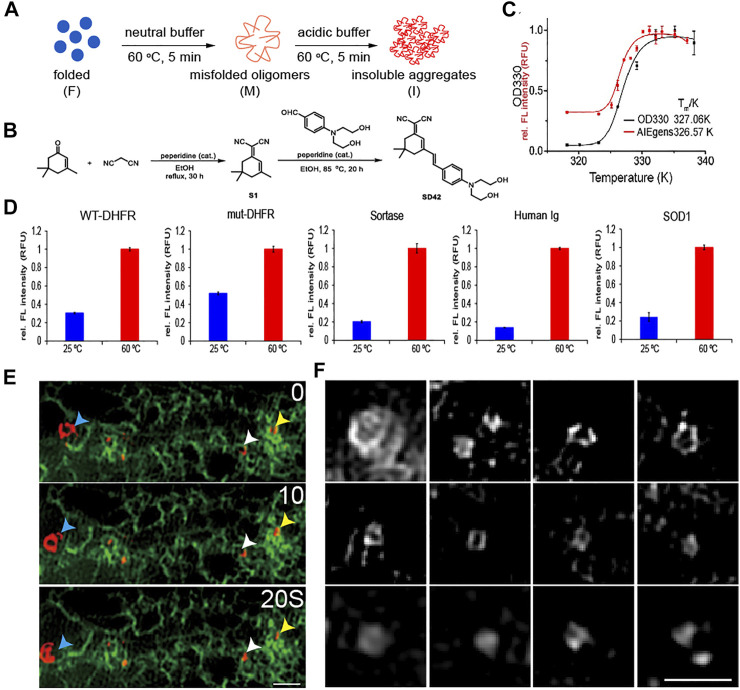
FIGURE 3.
Detecting unfolded and aggregated protein in vitro and in vivo by AIEgen. (A) A cartoon illustration of the formation of misfolded oligomers and insoluble aggregated DHFR model proteins. (B) Structural features of the AIEgen. (C) Thermal shift assay using OD330 turbidity (black curve) and the fluorescence of the AIEgen (red curve). Fluorescence of AIEgen occurs slightly earlier than the formation of insoluble aggregates measured by OD330 turbidity assay, indicating that the fluorescence originates from misfolded oligomers. (D) Fluorescence of AIEgen detecting the folded verses misfolded and aggregated proteins. AIEgen (25 M) and WT-DHFR (50 M), mut-DHFR (50 M), sortase (50 M), Human Ig (1 mg/ml) and SOD1 (50 M) were mixed in acidic aggregation buffer (NaOAc 200 mM, KCl 100 mM, acidified by AcOH to pH = 6.23) and incubated at 60 °C or 80 °C for 5 min. Spectra were collected with an excitation wavelength of 561 nm. (E) Both mobile (blue arrowhead) and immobile (white and yellow arrowheads) unfolded proteins are tightly associated with ER (green). Scale bar = 1 m. (F) SIM microscopy shows round shapes of unfolded proteins. Scale bar = 1 m.

