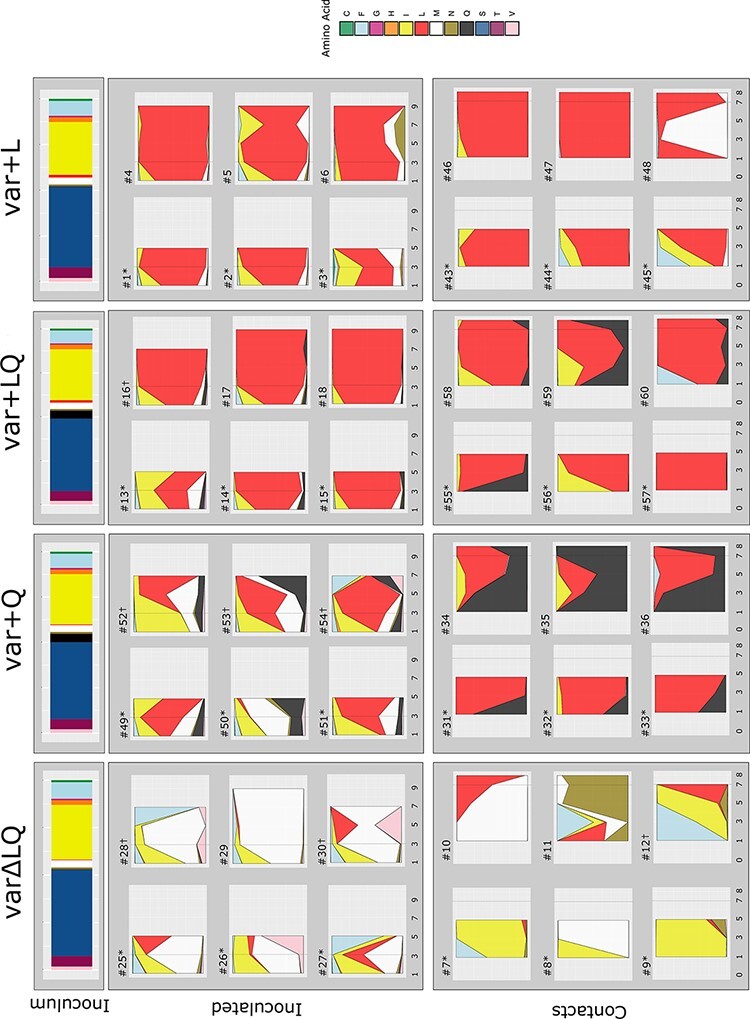
Figure 1.

Time series analysis of position HA 216 show that L216 is rapidly selected, but the dynamics depends on the competitors present in the inoculum mixture. In the top panel, the bars show the proportions of HA216 variants present in the inoculum. Below, the stacked area plots represent frequency of amino acids present in tracheal swab samples of inoculated and contact quails. Groups are designated as varΔLQ for mix of variant viruses in absence of L and Q at 216, var + L mix of variants viruses including L216, var + Q mix of viruses including Q216 and var + LQ mix of viruses including L216 and Q216. The specimens collected at 1, 3, 5, and 7 dpi from inoculated quails and 1, 3, 5, 7, and 8 dpc (x-axis) from contact quails were sequenced by NGS, and the amino acid frequency (y-axis) was calculated. Each plot represents a single quail (Q#) and each color represents a variant at position HA 216. Dotted grey lines show timepoints previously analyzed (Obadan et al. 2019). Quails that were euthanize for tissue collection are marked with asterixis. † = virus was below limit of detection in the last days of experiment or data did not meet quality cut off.
