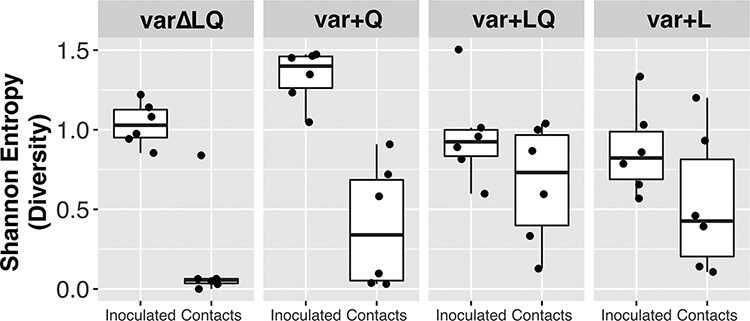
Figure 2.

Intra-group presence of L216 at high frequencies relaxes transmission bottleneck. Shannon entropy was calculated (y-axis) as a measure of diversity for position HA 216. Each dot shows the mean Shannon entropy calculated using 1 dpi and 3 dpi for the inoculated quail. For the contact quails, dots represent the Shannon entropy calculation at 1 dpc. Boxplots delimit lower and upper quartile with central line showing the median.
