
Figure 3. Correlation analysis identifies strain- and sex-dependent and independent physiological and metabolic responses to LP diet.
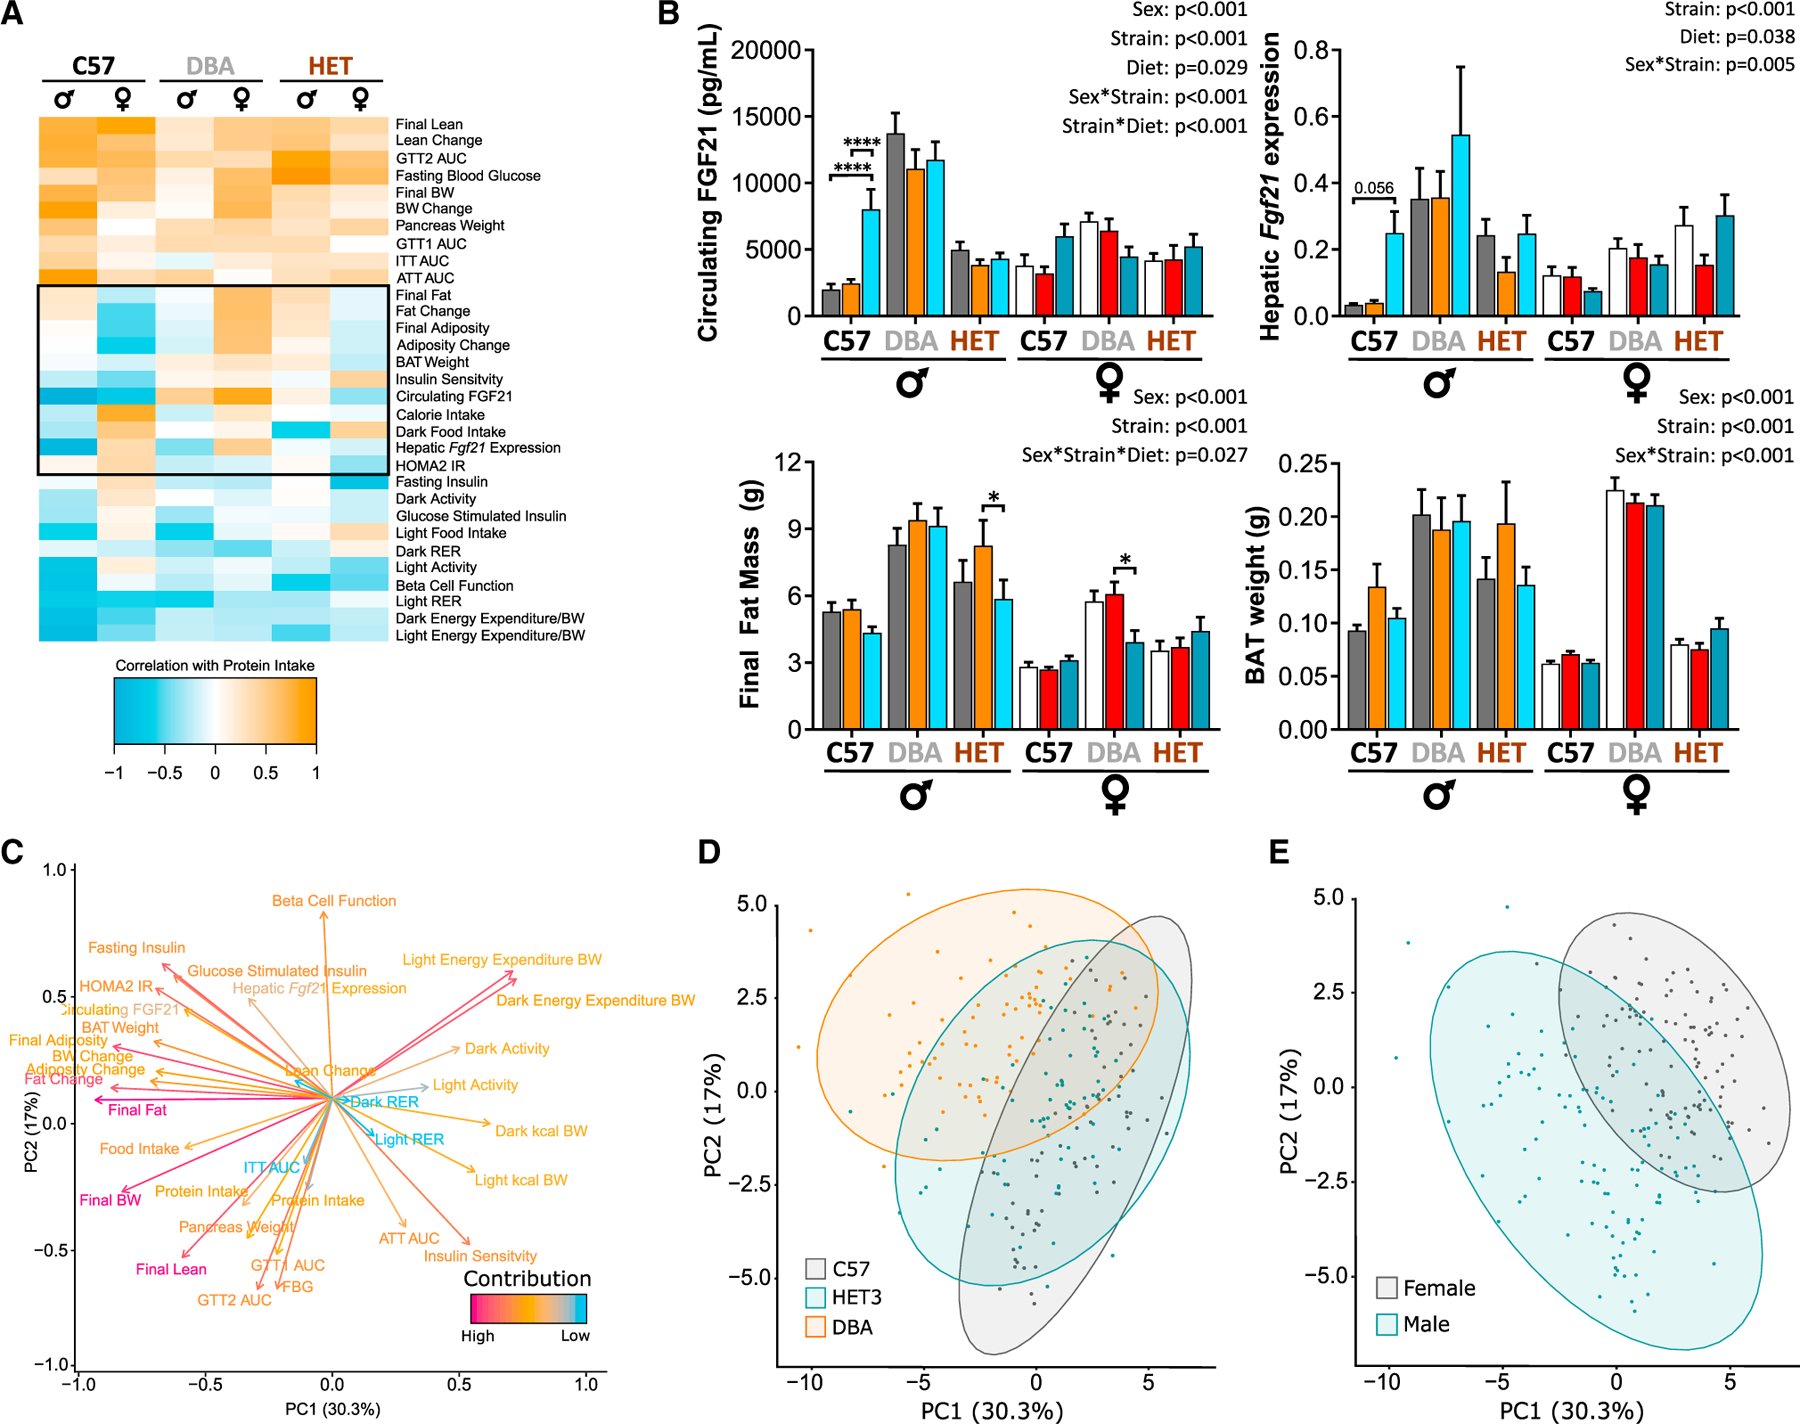
(A) Phenotypic measurements correlated with consumption of protein (kcals) in each mouse (Pearson’s correlation) and clustered (hierarchical clustering). Phenotypic measurements that do not cluster as well appear in the middle of the correlation plot (black outline).
(B) Selected phenotypic measurements within this black box were plotted.
(C–E) PCA on phenotypic measurements from each individual mouse.
(C) Phenotypic measurements were visualized: positively correlated variables point to the same side of the plot; negatively correlated variables point to opposite sides of the plot. Length and color of arrows indicate contribution to the principal components.
(D and E) Individual mice visualized by (D) strain and (E) sex indicating separation between the groups along PC1 and PC2.
(A–E) n for each measurement is detailed in Table S7.
(B) Three-way ANOVA between sex, strain, and diet groups with post hoc BH-adjusted test for pairwise comparisons; *p < 0.05, **p < 0.01, ***p < 0.001, and ****p < 0.0001. p values for the overall effect of sex, strain, diet, and the interactions represent the significant p values from the three-way ANOVA. Data are represented as mean ± SEM.