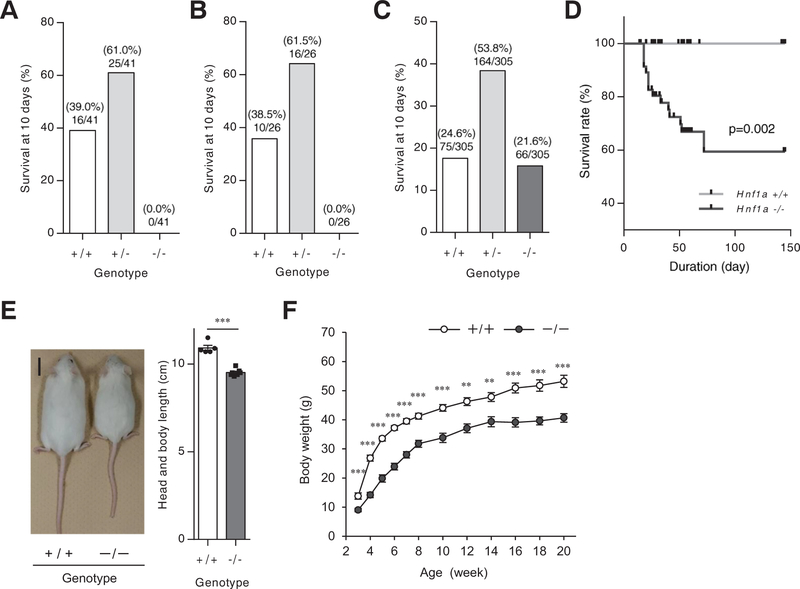
Fig. 1.
Phenotypic analyses of Hnf1a−/−mice on the ICR background. (A-C) Genotypic distribution at 10 days after birth. The number of Hnf1a wild-type (+/+), Hnf1a heterozygous (+/−), and Hnf1a null (−/−) mice born after being backcrossed 6 times with C57BL/6J mice (A), or with a pure C57BL/6J background (B), or born after being backcrossed 6 times with ICR mice (C) was counted (3–5 generations). The ratio on the bars indicates genotype-matched mouse number/total mouse number from multiple litters. (D) Kaplan-Meier survival curves for Hnf1a+/+ (n = 39; gray) and Hnf1a−/− (n = 66; black) littermates. p values were calculated using a log-rank (Mantel-Cox) test. (E) Gross appearance of 10-week-old Hnf1a+/+ (left) and Hnf1a−/− (right) mice. Scale bar, 2 cm. Body length (from the tip of the nose to the base of the tail) (n = 5–7) was measured. (F) Body weight chart for male Hnf1a+/+ (n = 63) and Hnf1a−/− (n = 65) mice from 3 to 20 weeks of age. All data are presented as mean ± S.E. (S.E.; error bars). **p < 0.01; ***p < 0.001.

