Fig. 3.
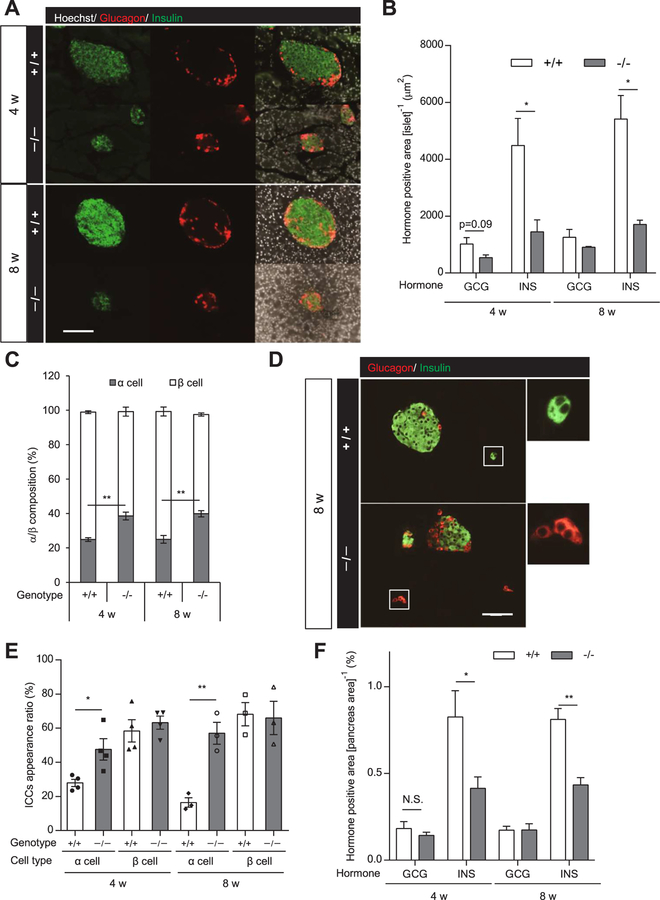
Islet cell composition and α-cell area in the pancreas of Hnf1a−/− mice. (A) α-cell and β-cell composition in each islet of 4- and 8-week-old mice. Immunofluorescence for insulin (green), glucagon (red), and Hoechst (white). Scale bars, 100 μm. (B) Glucagon (GCG)-positive and insulin (INS)-positive areas (μm2) in the islet area on the section were measured (n = 3–4). (C) Percentage of α-cell area and β-cell area to islet total area is shown (n = 3–4). (D) Representative image of ICCs in 8-week-old mouse pancreas. Immunofluorescence for insulin (green) and glucagon (red). Scale bars, 100 μm. (E) Appearance ratio of ICCs in 4- and 8-week-old mouse pancreas (n = 3–4). (F) Glucagon (GCG)-positive and insulin (INS)-positive areas in the whole pancreas area on the section were calculated (n = 3–6). +/+ and −/− indicate Hnf1a+/+ and Hnf1a−/− mice, respectively. All data are presented as mean ± S.E. (S.E.; error bars). N.S., not significant; *p < 0.05; **p < 0.01.

